Market Recap for Monday, July 1, 2019
The S&P 500 ($SPX, +0.77%) closed once again at an all-time high and all of our major indices ended Monday's session with gains. Leadership came in the form of the NASDAQ, which rang up a 1.06% gain. 9 of 11 sectors climbed, with two defensive groups - utilities (XLU, -0.25%) and real estate (XLRE, -0.19%) - the laggards. Technology (XLK, +1.59%) and financials (XLF, +1.20%) paced U.S. equities as money clearly supported the more aggressive areas of the market. Consumer discretionary (XLY, +0.88%) and communication services (XLC, +0.81%) also had strong days.
Technology (XLK) also closed at an all-time high on Monday and it's relative strength is one of many reasons why I expect to see a strong second half 2019 in equities:
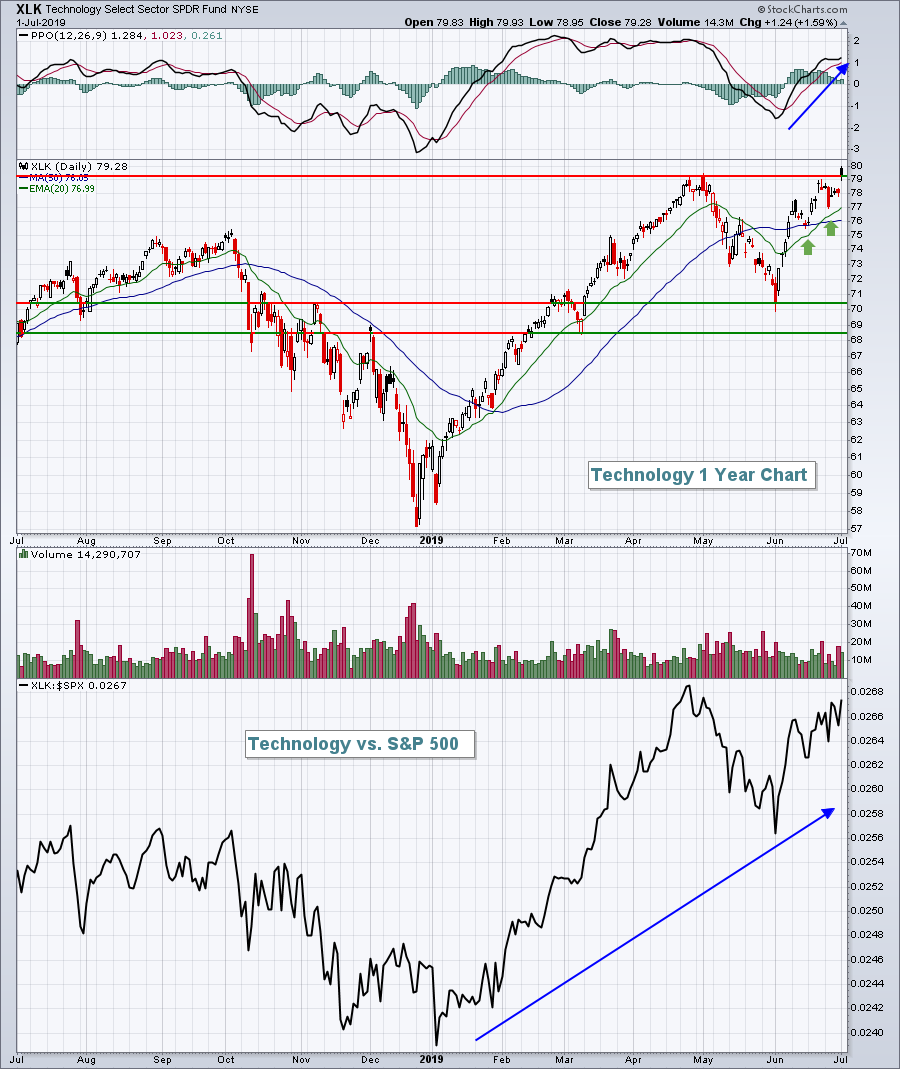 It's difficult to be anything but bullish when technology stocks are setting fresh all-time highs and leading U.S. stocks higher.
It's worth noting that all 12 industry groups within financials were higher on Monday, led by mortgage finance ($DJUSMF, +2.03%) and life insurance ($DJUSIL, +1.59%).
Pre-Market Action
The 10 year treasury yield ($TNX) is down 3 basis points this morning, back to the 2.00% level. Crude oil prices ($WTIC) are down 1.3% to $58.31 per barrel after unsuccessfully clearing $60 per barrel price resistance. This may have energy companies back on the retreat once again.
Asian markets were mixed overnight, while European markets are slightly higher. Dow Jones futures are down slightly (36 points) as we approach the start of a new trading day.
Current Outlook
If you've followed me for any length of time, you know that one of my "go to's" in terms of bull market sustainability revolves around the performance of consumer stocks. Why? Well, first consider that our GDP is roughly two-thirds consumer spending. When you break down consumer spending, you should do so into two buckets. The first bucket comprises those companies that sell the things we want. Those companies are consumer discretionary (XLY) companies. The second bucket comprises those companies that sell the things we need. Those companies are consumer staples (XLP) companies. You will likely buy soap and toothpaste, no matter the economic conditions. At least I hope so. Therefore, we should expect that consumer staples companies will perform much more consistently and have very little economic dependence. When you think of consumer discretionary companies, think of companies like Starbucks (SBUX) or retailers or home constructon. We want to buy their products, but if we grow very concerned about our jobs or we need to slow our spending, those are the first things to go.
That brings me to the XLY:XLP ratio. The stock market looks forward so if that XLY:XLP ratio is downtrending, that can be a very strong early warning signal about our future economic growth. But as long as it remains in an uptrend or bullish pattern, I feel bullish about the U.S. stock market. Here's where this relationship currently stands:
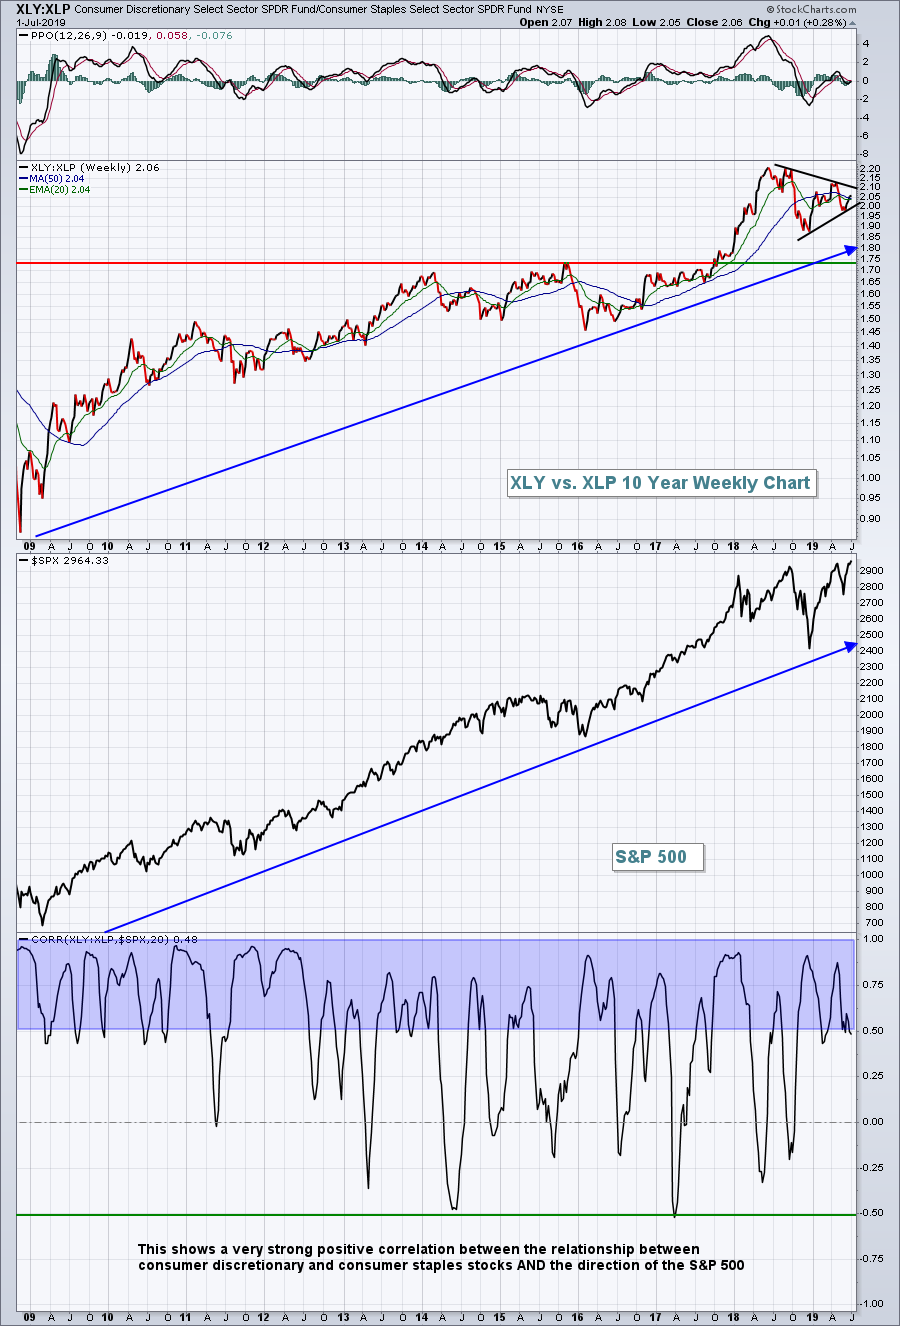 The bottom part of the chart highlights the very strong positive correlation between this XLY:XLP ratio and the direction of the S&P 500. It confirms exactly what makes good common sense. While we're not at all-time highs on this ratio, we are consolidating a very bullish trend higher during the first half of 2018.
Sector/Industry Watch
The Dow Jones U.S. Semiconductors Index ($DJUSSC, +2.13%) surged at Monday's opening bell, mostly due to relief that the US-China meeting did not result in an escalation of trade tensions between the two countries. During both of the previous escalations during Q4 2018 and in April/May of this year, the DJUSSC was crushed so traders in this space were rightfully nervous as the G-20 summit began in Japan. Apparently, no news was good news as many semiconductor companies directly impacted by our trade relationship with China had strong days yesterday. While we can grow impatient with all the daily volatility in this group, the weekly chart remains in a solid long-term uptrend:
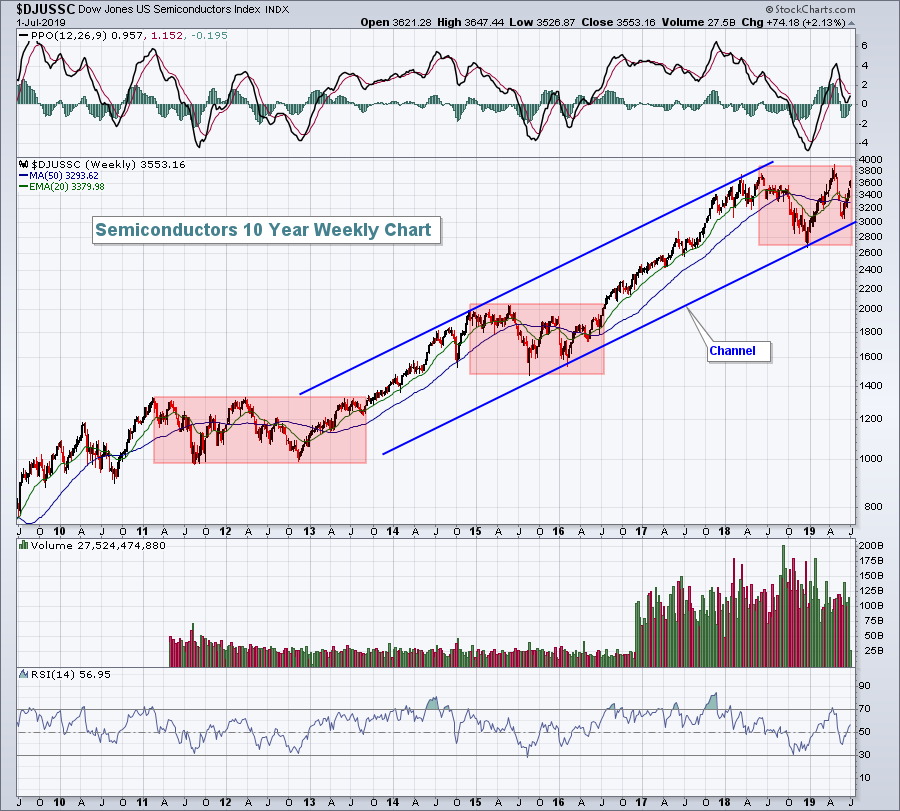 Sometimes it helps to take a step back and look at the big picture as the daily noise can be difficult to deal with emotionally. Yes, semiconductors are extremely volatile, but currently all that volatility is occurring within a consolidation phase that's all part of a much bigger long-term up channel.
Historical Tendencies
We typically see a pre-earnings push higher from late-June through mid-July. The S&P 500 has produced annualized returns of +24.92% during the period from June 27th (close) to July 17th (close) since 1950.
Key Earnings Reports
(actual vs. estimate):
AYI: 2.50 - estimate, awaiting results
SMPL: .16 vs .14
Key Economic Reports
None
Happy trading!
Tom
