Market Recap for Tuesday, July 9, 2019
Despite the Dow Jones ($INDU, -0.08%) finishing in negative territory, I'd argue it was a pretty solid day on Wall Street. All of our major indices opened lower, but there was buying throughout the session, much like Friday. We saw leadership from aggressive areas as the NASDAQ rose 0.54% and the small cap Russell 2000 was able to climb into positive territory by the close, ending higher by 0.08%. All aggressive sectors rose as well, with industrials (XLI, -0.22%) the only exception. Airlines ($DJUSAR, -1.09%) and truckers ($DJUSTK, -0.66%), two thorns in the transportation area ($TRAN, -0.74%), contributed to weakness there. The DJUSAR, quite notably, failed at key short-term price resistance:
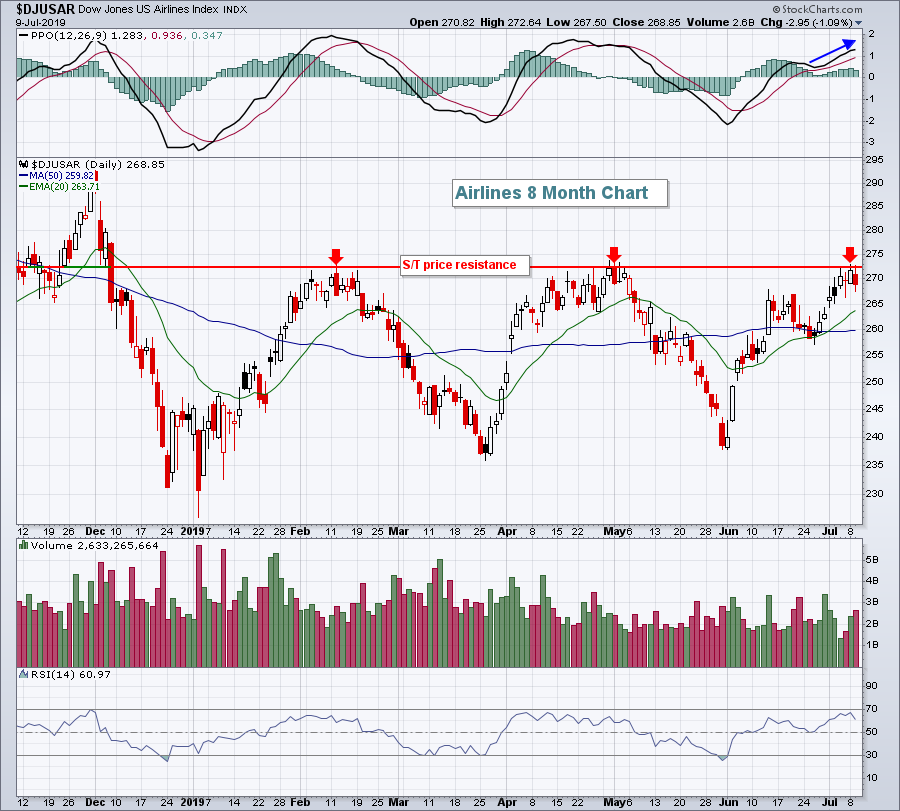 Momentum is quite strong here, as evidenced by the strengthening PPO, so a breakout should be respected. If we do see a breakout here, consider the leaders in the area to include Delta Airlines (DAL) and COPA Holdings (CPA).
The FAANG stocks were all higher on Tuesday and that certainly contributed to strength in NASDAQ stocks. It also didn't hurt to see a $26 billion cash acquisition of Acacia Communications (ACIA, +35.06%) by Cisco Systems (CSCO, +0.27%). Many times acquirers lose ground the day of a large acquisition because it's typically dilutive. However, in this case, CSCO acquired ACIA in an all cash deal. Therefore, they are issuing no additional shares of stock and thus avoid any dilution. I expect this deal to continue to be viewed positively for CSCO, with a breakout on the horizon:
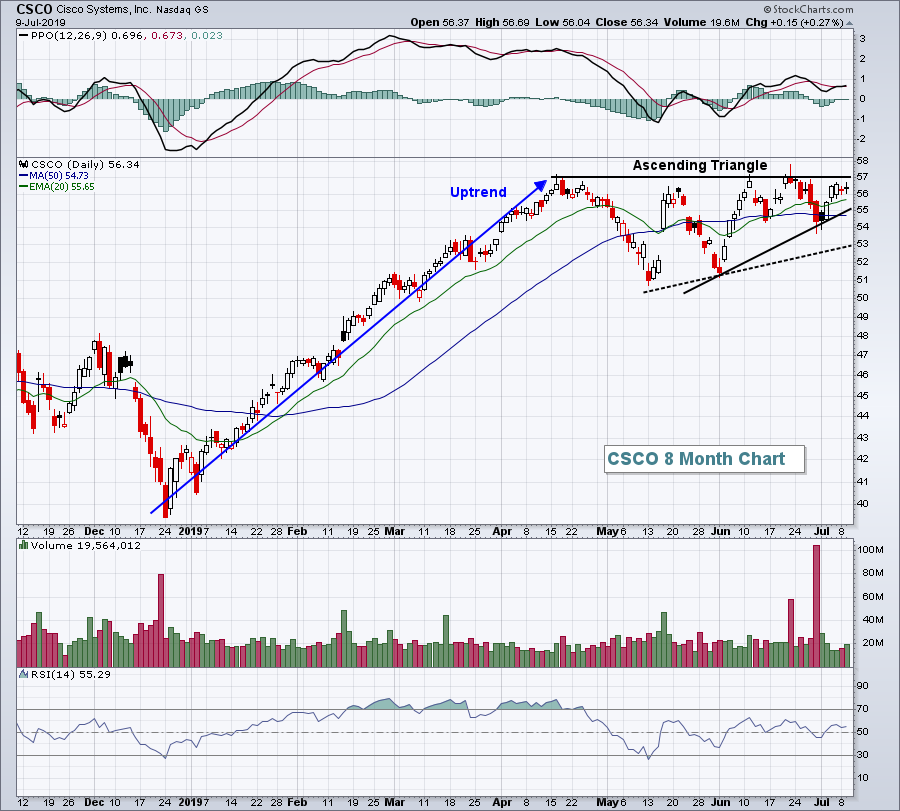 The solid black lines outline the current bullish ascending triangle continuation pattern, which follows a solid uptrend. That begs for a breakout. The dotted black line is what I'd look to develop if short-term price support near 54 is lost. The bullish pattern would be completely negated on a close below 51, particularly if accompanied by heavy volume. I remain very bullish on CSCO, however.
Pre-Market Action
Crude oil ($WTIC) is jumping in pre-market action, up 2.44% and nearing $60 per barrel once again. The 10 year treasury yield ($TNX) is dipping, down a basis point and just below 2.05% at last check. Gold ($GOLD) is up $10 per ounce to $1410. Fed Chair Jerome Powell is testifying to Congress and is hinting at a needed rate cut, which has completely turned around U.S. equity futures. They were down earlier, but with the rate cut more likely and confirmed by the Fed Chief, Dow Jones futures are now higher by 50 points. They were down over 100 points earlier this morning.
Current Outlook
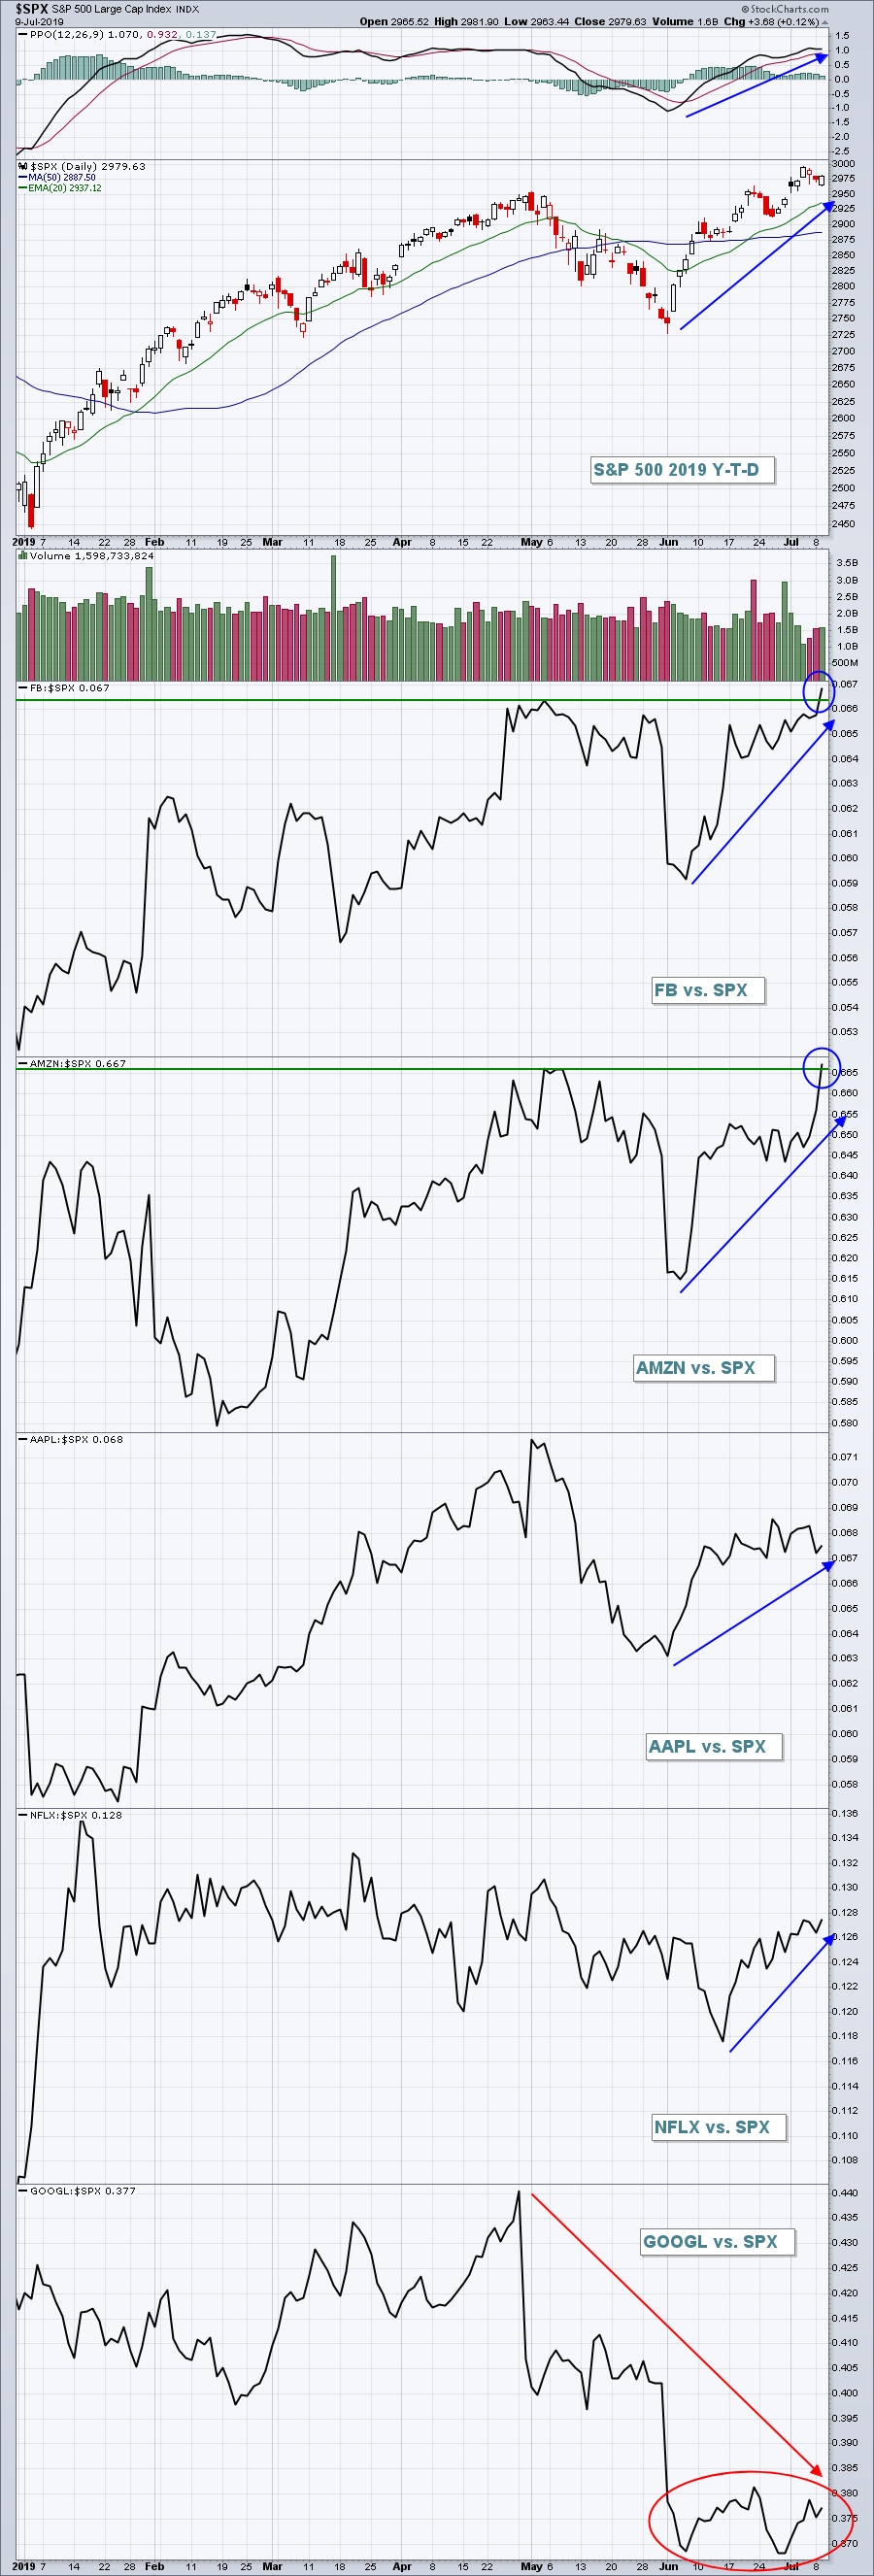
FAANG is an acronym that means Facebook (FB), Amazon.com (AMZN), Apple (AAPL), Netflix (NFLX), and Alphabet (GOOGL). It could be FAANA because of Alphabet, but that doesn't have a ring to it. And besides, who says Alphabet? I'll always know the company as Google. There's your "G" in FAANG. At yesterday's close, these 5 companies had a combined market capitalization of $3.4 trillion. How they're performing is going to have a major impact on U.S. equities. So how are they performing? Well, the benchmark S&P 500 has been rising and so too have these five stocks. But are they outperforming?
 How cool is this chart?
CLICK HERE to start your FREE 30 day trial.
Seriously, if you're not a member of StockCharts.com, you should see the membership value by simply looking at this one chart. Here's how Wall Street's MONEY is ranking the 5 FAANG stocks:
#1 - Facebook (FB) - breaking out to new relative high, expect blowout earnings report
#2 - Amazon.com (AMZN) - another blowout earnings report around the corner
#3 - Apple (AAPL) - not breaking out on relative basis yet, but gaining relative strength since June bottom.
#4 - Netflix (NFLX) - also gaining in June on relative basis, but longer-term relative downtrend still in play.
#5 - Alphabet (GOOGL) - I'd avoid. I don't know what's going on here, but Wall Street says NO. We should too.
They'll tell you anything, but their money only speaks one language.
Relative strength is powerful. If you want to keep learning more and more and more about it and improve your investing/trading results, consider the EarningsBeats.com Digest newsletter. It's 100% free and will give you relative strength wisdom three times a week. CLICK HERE to sign up.
Sector/Industry Watch
Industrials (XLI) did pull back yesterday, but the reason is rather obvious. Sellers are lining up at very significant overhead price resistance:
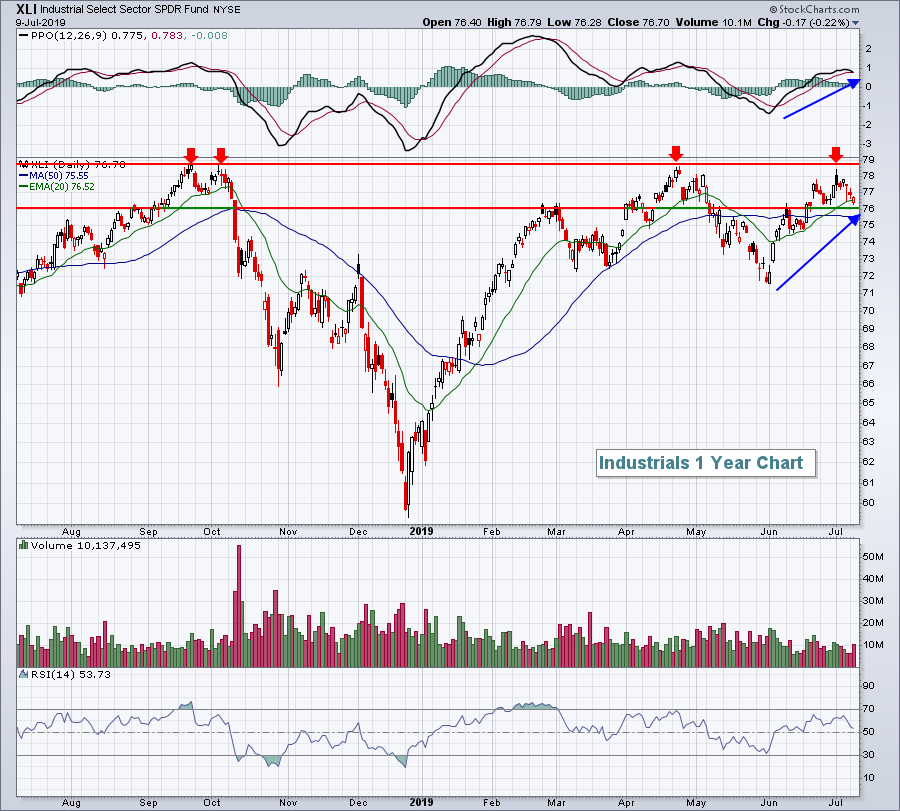 The good news is that the XLI did reverse off its intraday lows and managed to close above its rising 20 day EMA. This chart remains very bullish in my view and doesn't require re-evaluation unless the 76 price support level is lost.
Historical Tendencies
Beginning tomorrow, the next two weeks will be quite interesting. Since 1971, the NASDAQ has produced annualized returns as follows for the next two weeks:
July 11-17: +61.66%
July 18-24: -41.08%
Key Earnings Reports
(actual vs. estimate):
MSM: 1.45 vs 1.50
(reports after close, estimate provided):
AIR: .62
BBBY: .08
PSMT: .42
Key Economic Reports
May wholesale inventories to be released at 10:00am EST: +0.4% (estimate)
Happy trading!
Tom


