Special Note:
On Monday, September 16th, I will officially begin writing full-time at EarningsBeats.com as its Chief Market Strategist, returning to a role that I left in March 2015 when I joined StockCharts.com as a Sr. Technical Analyst. Below is a brief example of the type of information that I intend to provide our EarningsBeats.com members on a daily basis. I will be providing additional information regarding earnings reports, historical information, industry group strength/weakness, etc. similar to what I've provided here in Trading Places the past 4+ years. I just wanted to give you a sample of the type of charts you can look forward to every day as an EarningsBeats.com member.
To fully experience membership, I'd strong encourage you to consider a $7 30-day trial, which would include receiving a copy of the entire Strong Earnings ChartList if you're at least an Extra member here at StockCharts.com. If you're not a member at StockCharts or your membership level is lower than Extra, we can send you a link to view the 329 charts with price support annotated on each chart.
I'd love to have your support as I begin this new venture with EarningsBeats.com. CLICK HERE to start your $7 30-day trial! Thank you so much for your support!
Executive Market Summary:
- Dow Jones rises for 8th straight day, nearing its all-time closing high of 27,359 set on July 15th
- Headline retail sales stronger than expected for August, jumping 0.4% vs. the expected 0.2%
- 10 year treasury yield ($TNX) surges 11 basis points to 1.90% to close above 50 day SMA
- Materials (XLB) lead a bifurcated session with just 4 sectors advancing
- Real estate (XLRE) ends rough week with more selling
Sector/Industry Focus
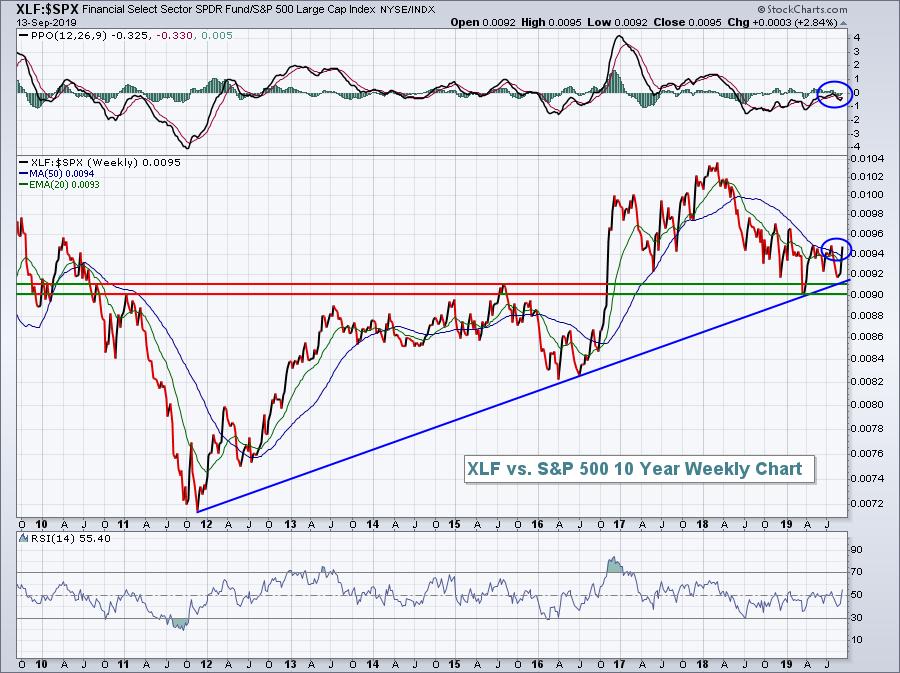
The financial sector (XLF) is beginning to show the relative strength it exhibited in 2016 and throughout 2017 before the back-and-forth, high volatility began in January 2018. I want to see wide participation during a bull market and I believe we remain in a secular bull market. The XLF is showing relative strength at a time when it needed to on its 10 year weekly chart:
Industrials (XLI), buoyed by newly found leadership in transports ($TRAN), is bouncing off a similar long-term relative support trendline:
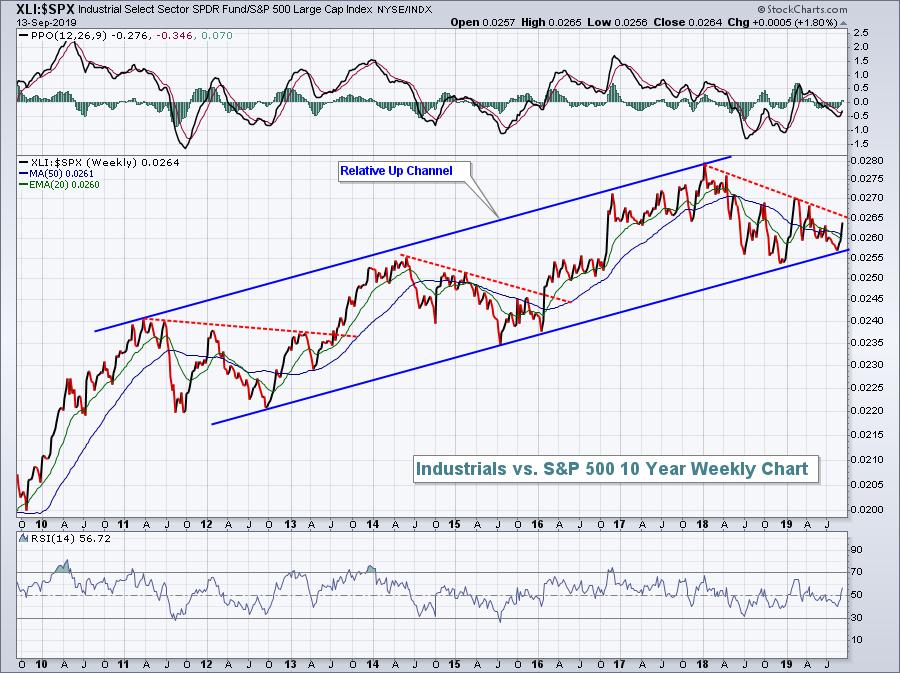
These are extremely bullish developments and are likely to lead to further gains and new record all-time highs for our major indices.
Strong Earnings ChartList:
The Strong Earnings ChartList is a list of companies that, in their most recent quarterly earnings reports, beat Wall Street consensus estimates as to both revenue and earnings per share (EPS). In addition, they are adequately liquid and also were technically sound after reporting their results. Currently, there are 329 companies on this Strong Earnings ChartList. I've run scans against this ChartList and the following highlights companies that meet the criteria shown.
New 52 week highs - 31 of 329 stocks
I further broke down this list of 31 Strong Earnings ChartList stocks to identify those in the financial space that are setting new 52 week highs and here was the result:
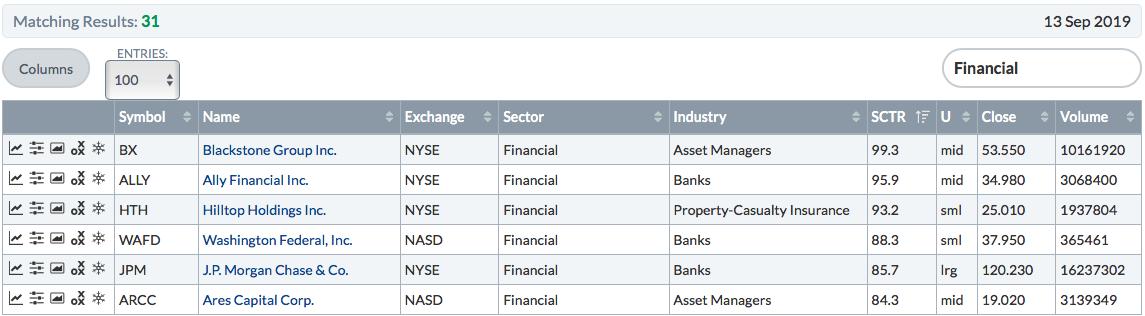
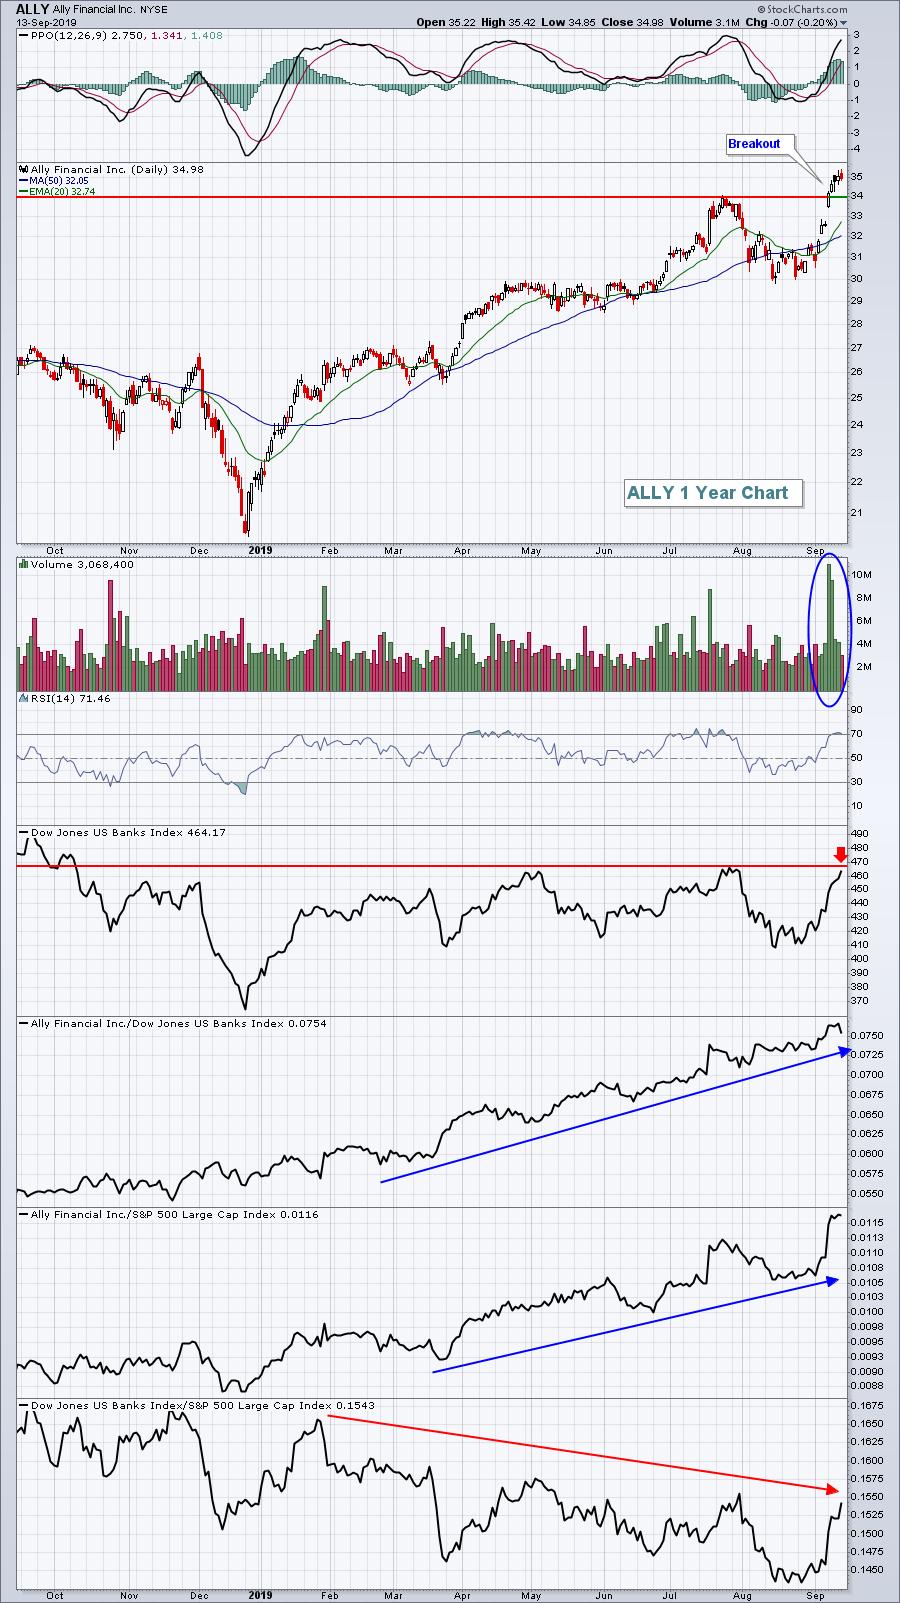
ALLY has been a favorite of mine for awhile. Banks ($DJUSBK) have been a difficult area to trade on the long side as treasury yields kept tumbling, but now that yields are on the rise, you can quickly see how relative strength plays a key role. Check out ALLY's chart:
If you're interested in a bigger name, then JP Morgan (JPM) could be the right financial for you. While we've yet to see the DJUSBK break out, JPM is setting new 52 week and all-time highs:
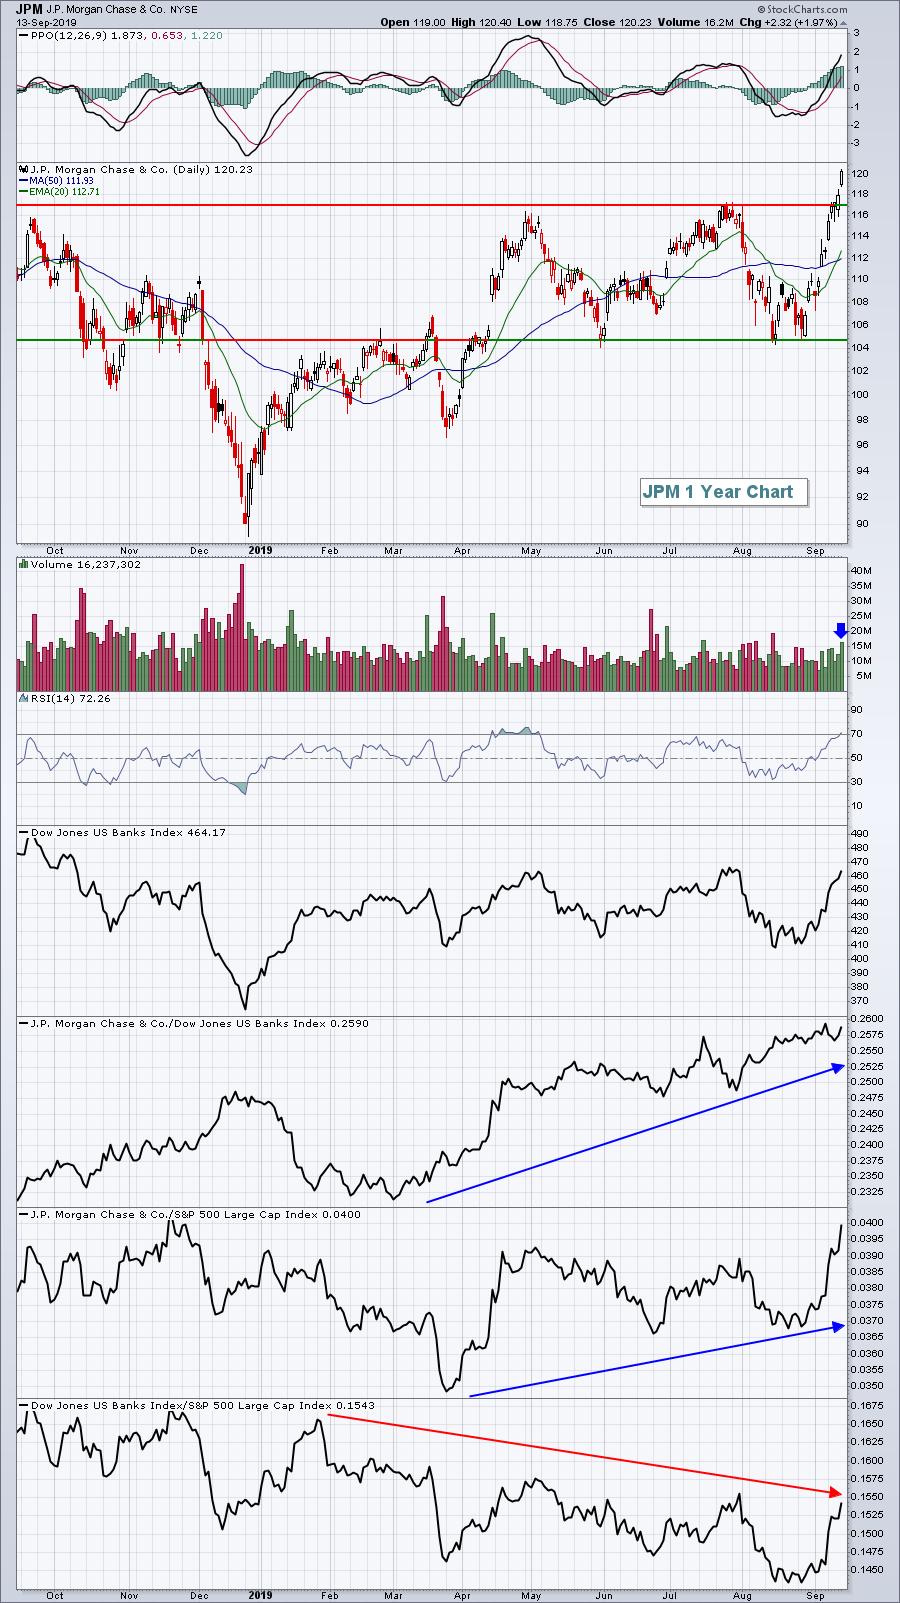
Volume has been strong on both of these stocks to confirm their absolute and relative breakouts. They appear to be solid trading candidates within the financial sector and, more specifically, the banking industry.
High volume stocks, trading more than 2x normal daily volume - 11 of 329 stocks
Here's a table showing the Strong Earnings ChartList stocks that made the cut today:
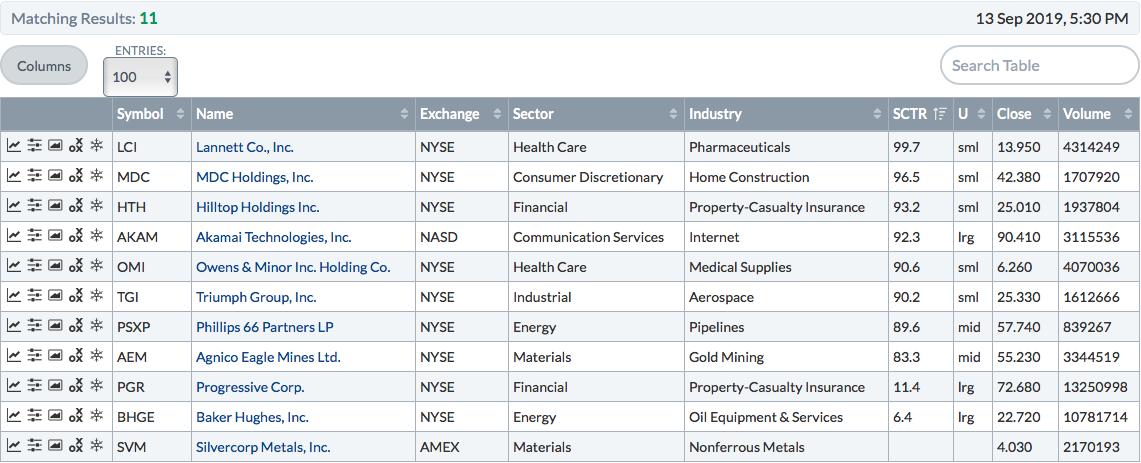
Here are two stocks that stick out to me technically. First, Triumph Group's (TGI) heavy volume accompanied a breakout to a new closing high:
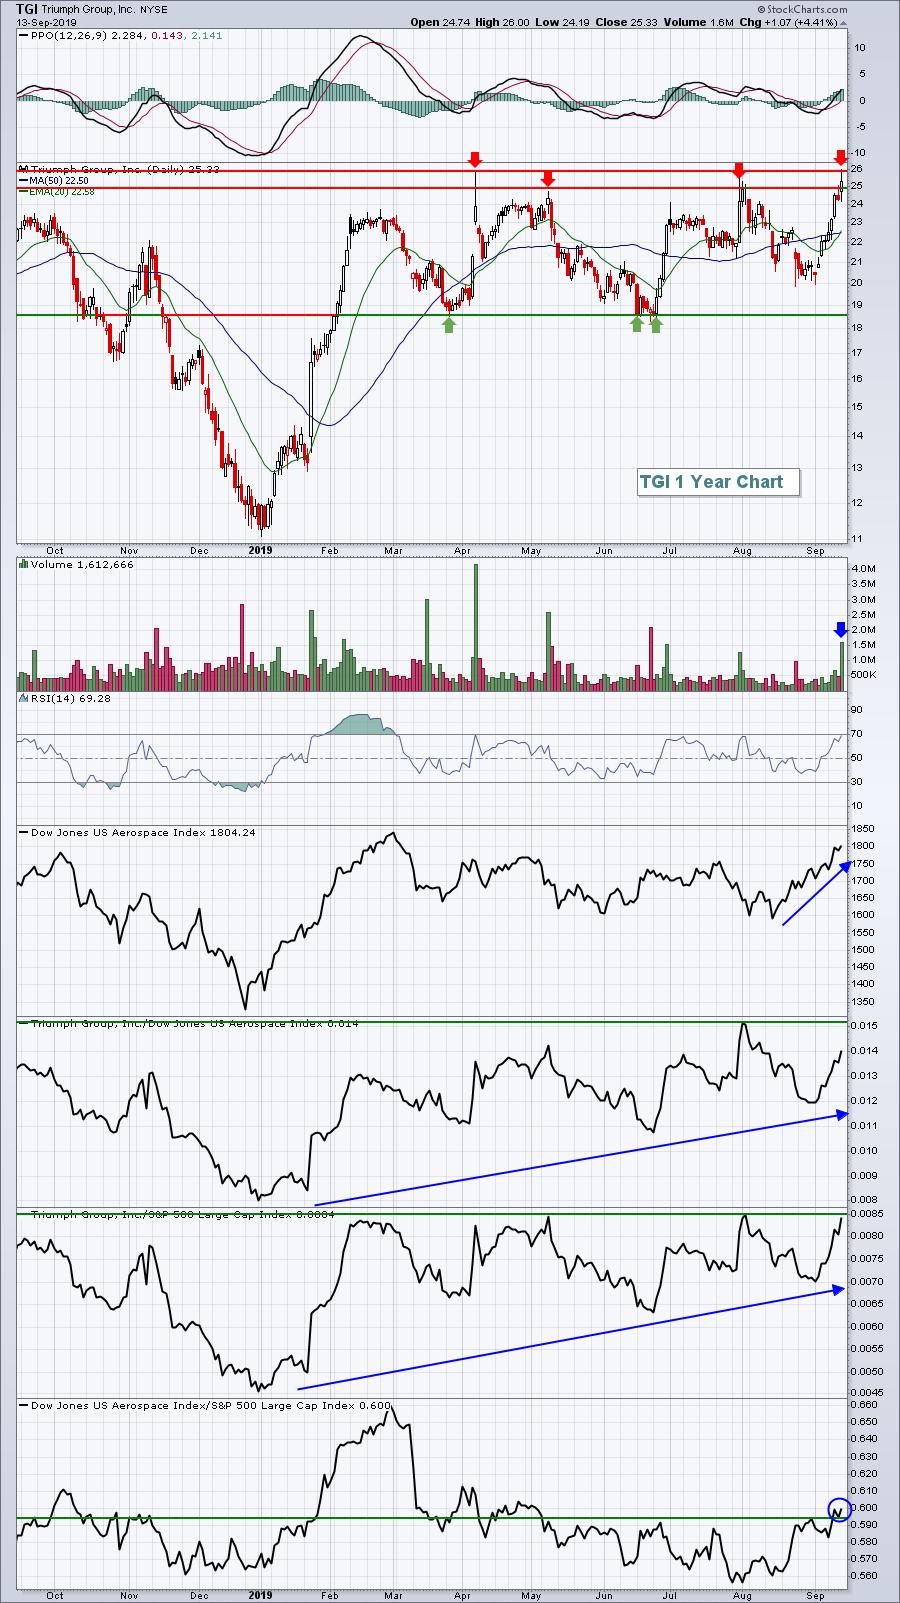
TGI still has some work to do, most notably building on its Friday breakout. We've seen TGI turn back down from this area a few times already in 2019. I do like the building strength in aerospace ($DJUSAS), however, and TGI has been uptrending on a relative basis vs. its aerospace peers.
Next up is Owens & Minor (OMI), which has been soaring since its early August gap higher on massive volume. Sellers have been in control the past two days, however, and I see two major support levels - the first at the rising 20 day EMA that was tested today and the second at its most recent price breakout, closer to 5.25:
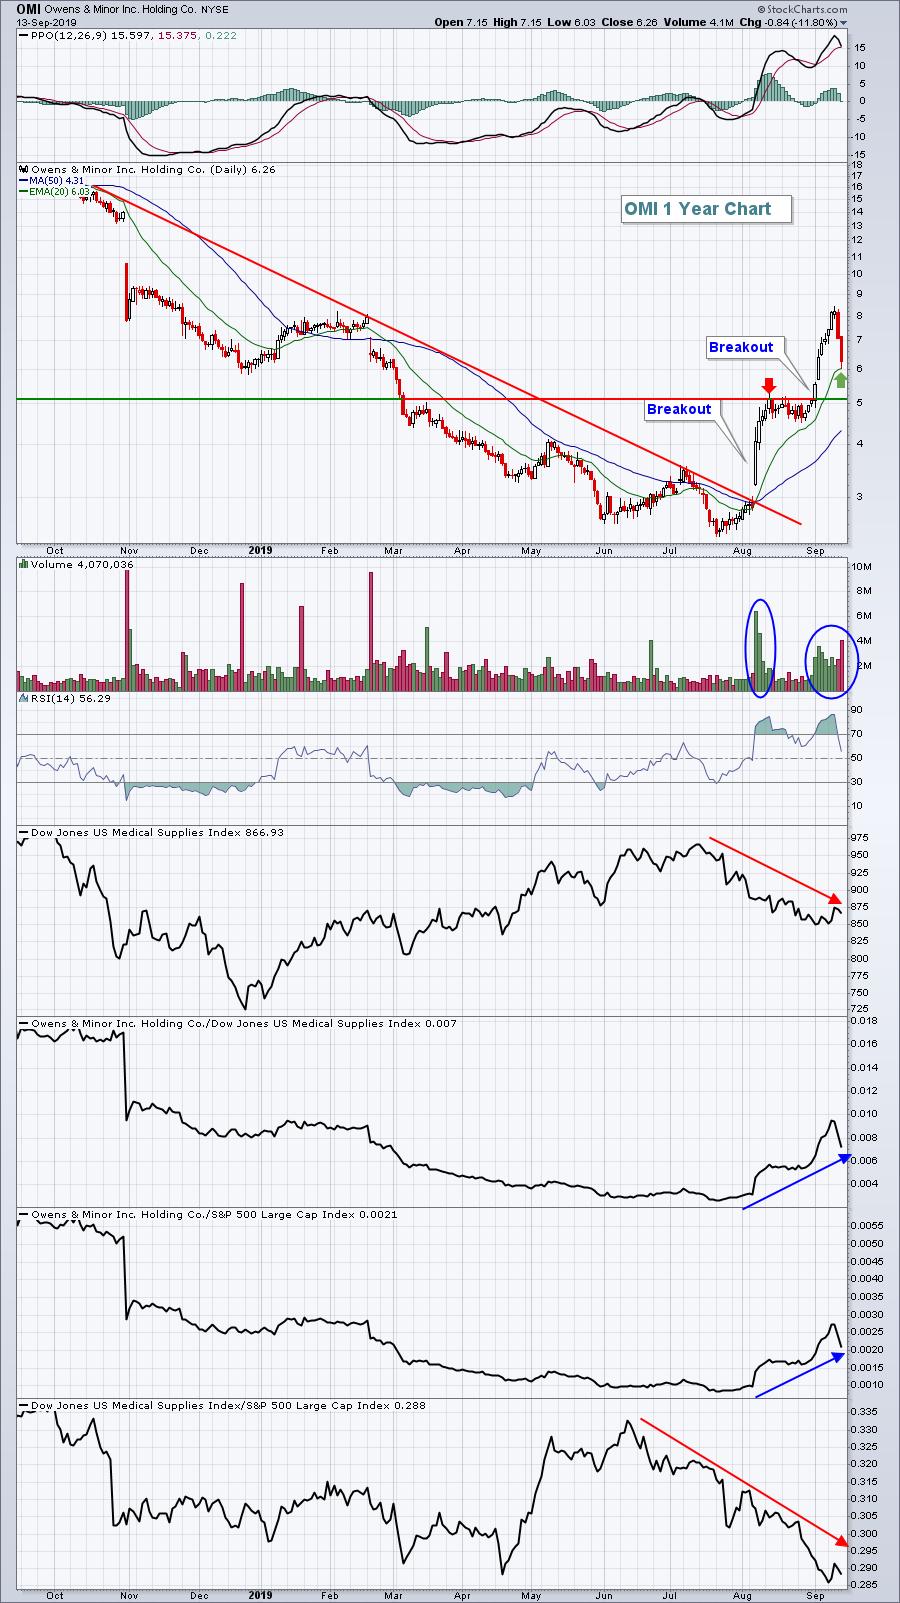
OMI was a very beaten-down stock and it's made a huge move off its recent bottom. Therefore, it's likely to remain a volatile stock, more appropriate for traders willing to take on much higher risk in an attempt to earn potentially higher returns. A short-term move higher to retest the 8.50 level isn't out of the question.
Movers Today:
I don't trade stocks outside the Strong Earnings ChartList, but I know many of you do. I try to find a couple stocks that I believe have more upside potential based on a current assessment of their technical picture. I'll start this section with a smaller, risky stock - MDC Communications Corp (MDCA), which after printing a bearish engulfing candle on Thursday, fell back to test its rising 20 day EMA and stormed back to close at a 2 month high on increasing volume:
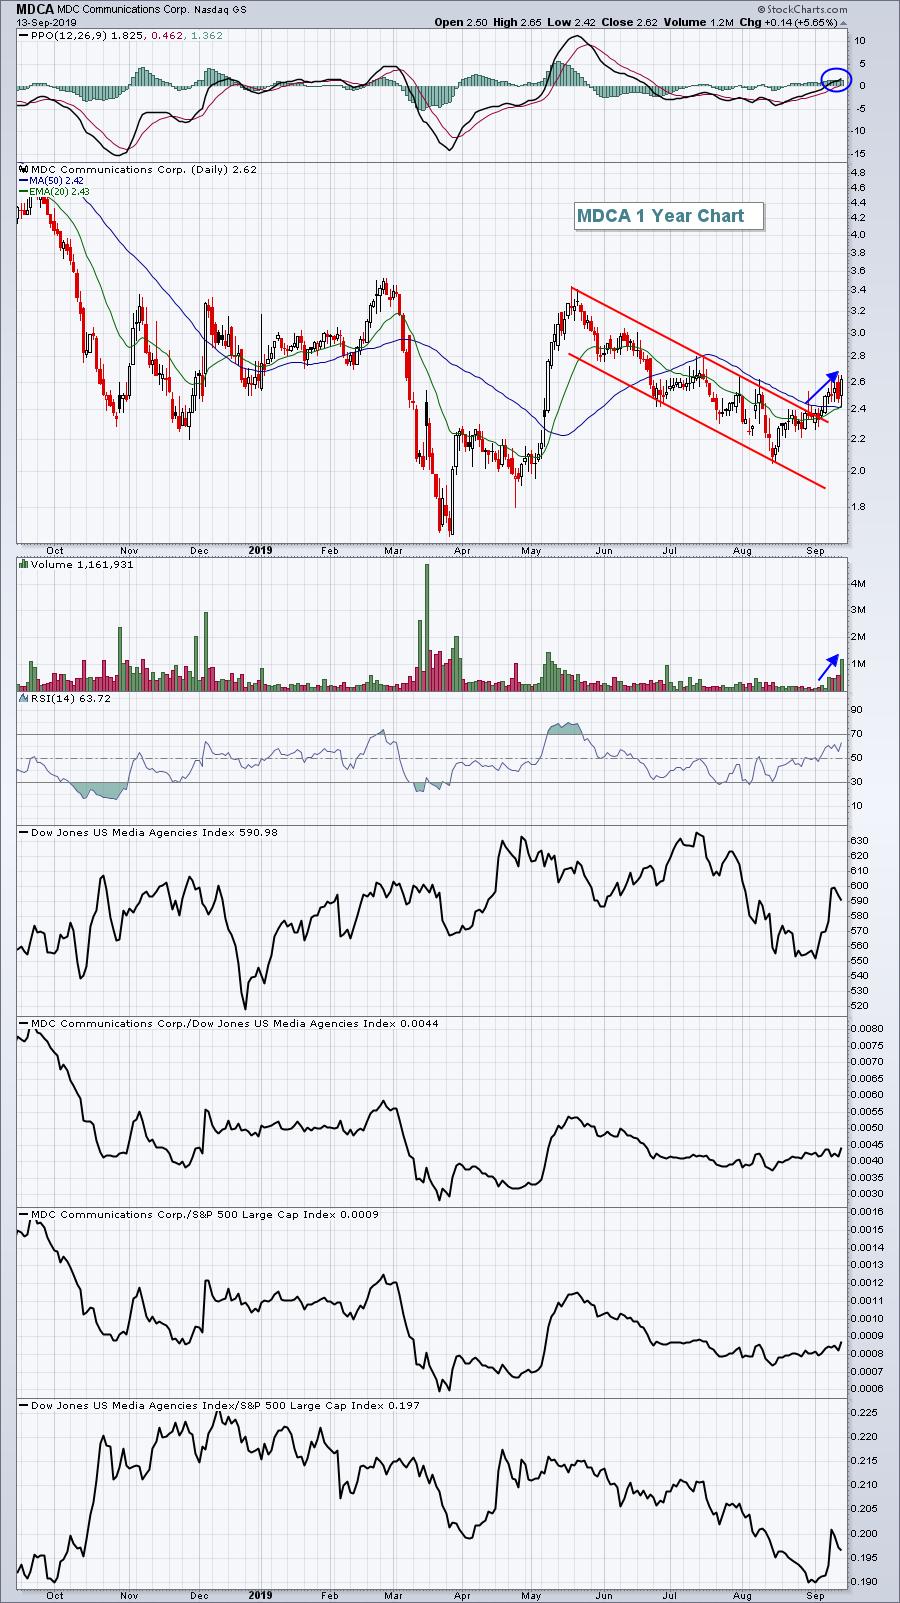
The relative charts do not inspire me, so if I traded it, I'd have a very short-term mentality - make my money and SCRAM! I expect to see MDCA top out in the 3.00-3.50 area.
Next up is a much larger company that doesn't carry the type of inherent risk that MDCA does. McKesson Corp (MCK) is a leading pharmaceutical ($DJUSPR) stock. I know pharmas have been weak, but so were financials two weeks ago. MCK is showing signs of strengthening after working off a recent negative divergence:
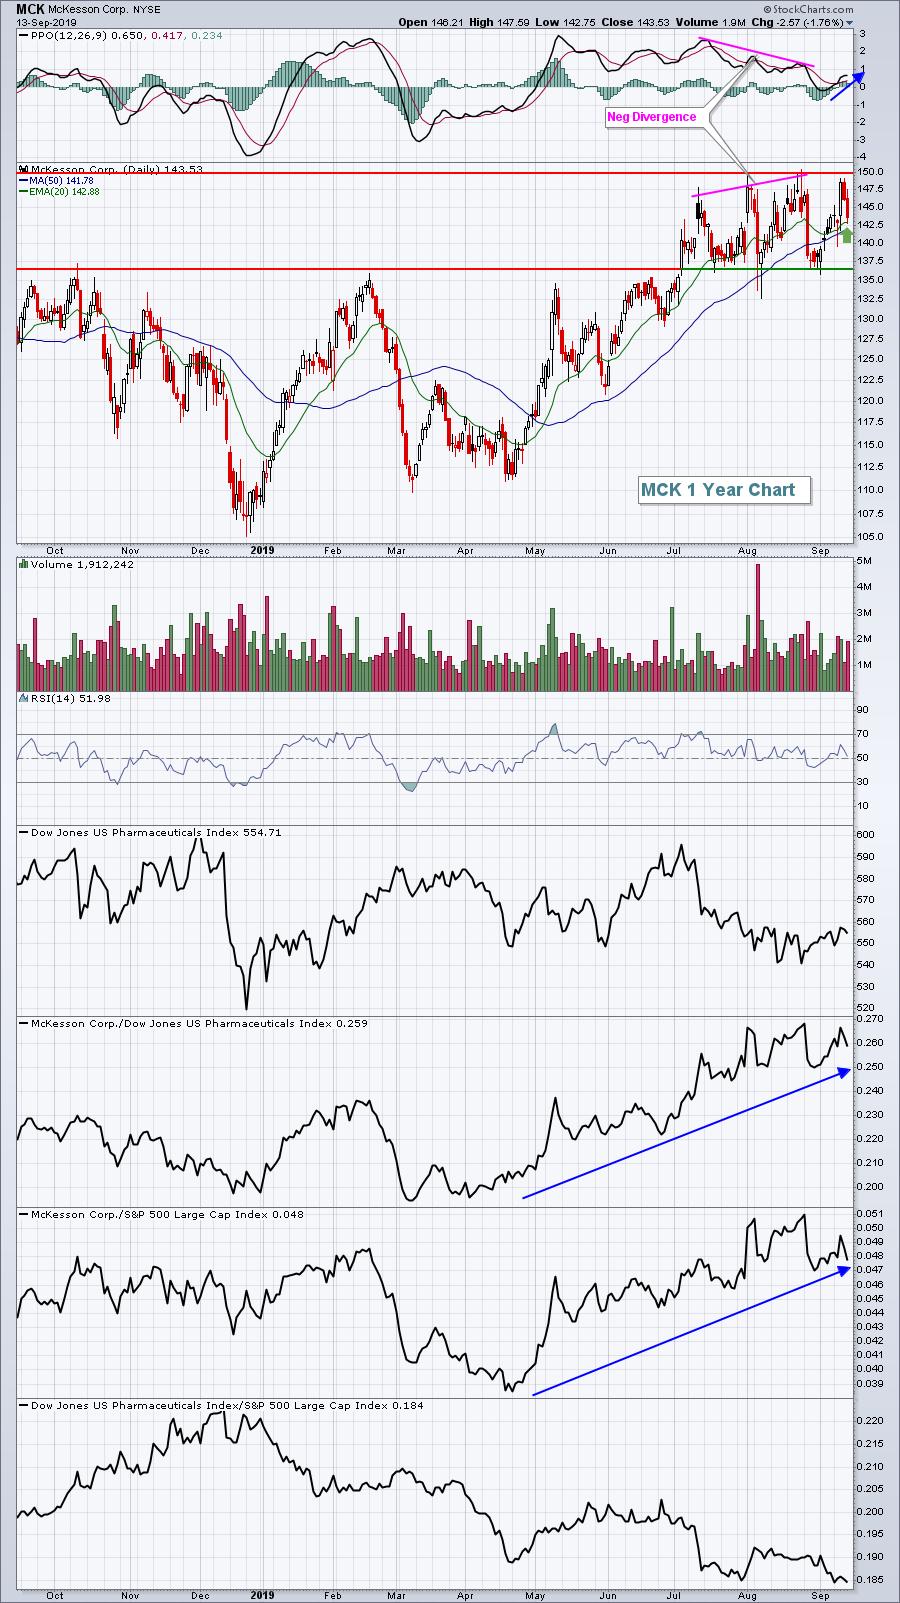
It's quite possible that MCK surges off today's 20 day EMA test, but even if it doesn't, it has a history of very strong price support closer to 136-137. Therefore, risk here can be contained quite nicely.
Happy trading!
Tom


