Market Recap for Thursday, September 5, 2019
U.S. indices had a strong day on Thursday, with leadership from key aggressive areas. The small cap Russell 2000 ($RUT) led the action with a solid 1.75% gain. More on the RUT in today's Current Outlook section below. The NASDAQ also gained 1.75%. The Dow Jones and S&P 500 climbed as well, tacking on 1.41% and 1.30%, respectively. Among sectors, the five aggressive areas - technology (XLK, +2.09%), financials (XLF, +2.04%), consumer discretionary (XLY, +1.91%), industrials (XLI, +1.80%), and communication services (XLC, +1.70%) - landed in the top 5 spots. That's exactly the type of market behavior I want to see when our major indices make significant upside breakouts. The breakout on the S&P 500 is shown below:
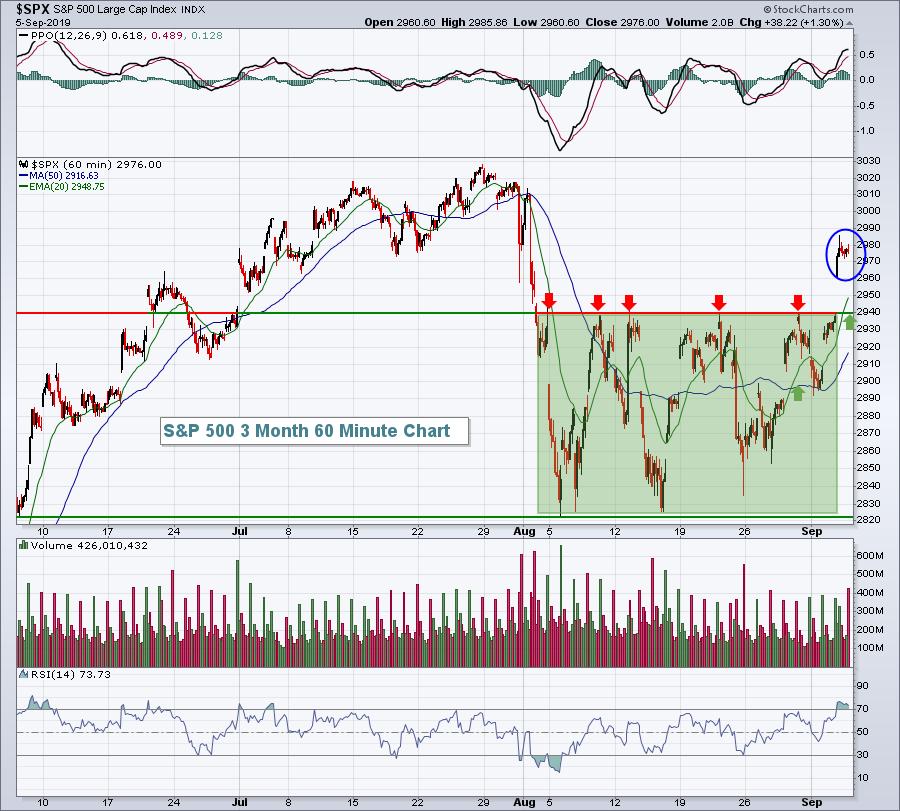
After 5 attempts to clear 2940, the 6th time was a charm. Seeing leadership from aggressive areas on a key breakout day adds bullishness to the day's action, in my view.
As you might expect, the defensive areas struggled on a relative basis. Utilities (XLU, -1.08%), real estate (XLRE, -0.87%), and consumer staples (XLP, -0.62%) very badly lagged on the session.
Pre-Market Action
Crude oil ($WTIC) is down roughly 1%, while both gold ($GOLD) and the 10 year treasury yield ($TNX) are relatively flat.
Overnight, Asian markets were higher on the heels of Thursday U.S. strength. European markets are mostly positive this morning and the bias in the U.S. remains fairly positive as well, despite a disappointing jobs report this morning. Dow Jones futures are higher by 96 points with 30 minutes to the opening bell.
Monday's Special Event
I'm really excited to announce a very special event on Monday, September 9th at 4:30pm EST. I'll be announcing our new and improved products and services lineup and describing them in detail. If you're not already aware, our portfolios each represent 10 equal-weighted stocks in 10 different industries and they're crushing the S&P 500 returns since their respective inceptions. Our longest running portfolio - the Model portfolio - is up 56.11% vs. the benchmark S&P 500's 10.60% return. Every portfolio has beaten the S&P 500 in every quarter thus far. I'll detail the selection process and (paid) subscribing members receive the 10 stocks in each portfolio on the day they're announced.
The session will be information-packed and there will be plenty of tips and tricks for investors and traders of all types - both short-term and long-term.
The event is completely FREE. For more information and details regarding the event and how to register, simply CLICK HERE! I sure hope to see you there!
Current Outlook
The small cap Russell 2000 ($RUT, +1.75%) has been a laggard for most of the past year when compared to the S&P 500. But on an absolute basis, there's at least a light at the end of the tunnel. The RUT broke above its declining 20 day EMA on yesterday's close and a similar move after May's swoon led to additional absolute gains, although relative strength vs. the SPX never materialized. It would be more bullish for equities if we began to see leadership from small caps:
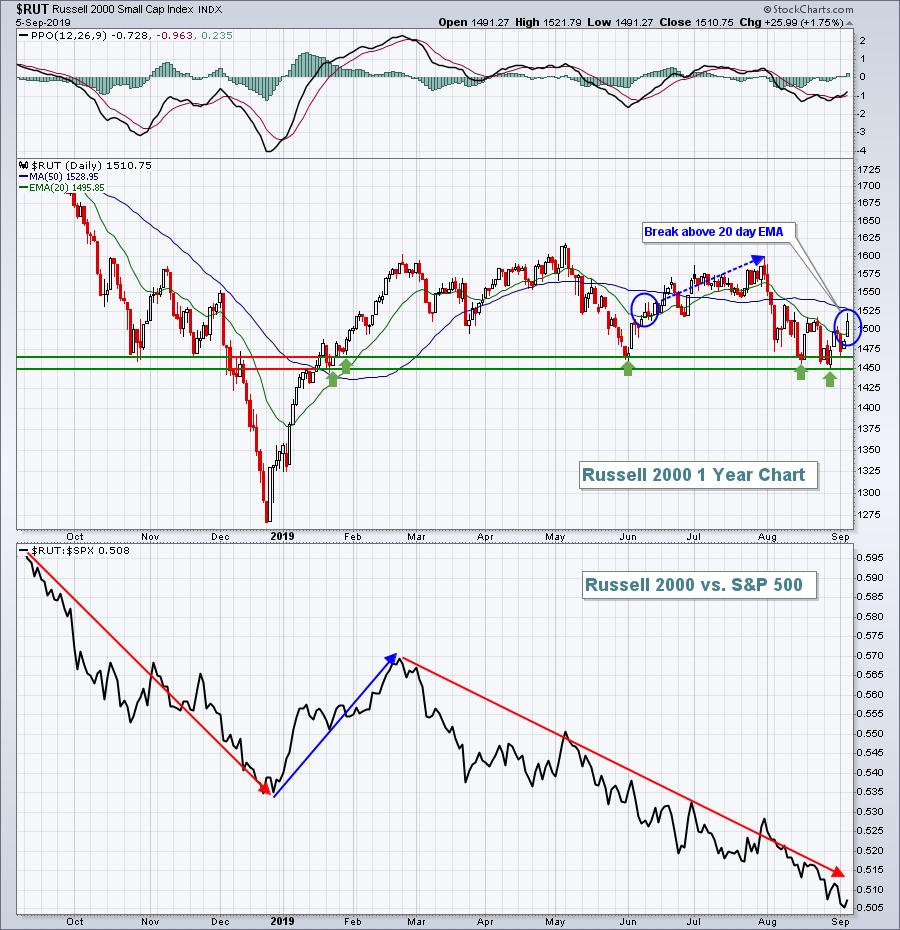
The .505 relative level that was just reached is nearing relative lows from 2004-2005, so it's certainly time to see leadership in this space.
Sector/Industry Watch
The Dow Jones U.S. Banks Index ($DJUSBK, +2.48%) led a nice rally in financials (XLF) after recently holding a key price support level:
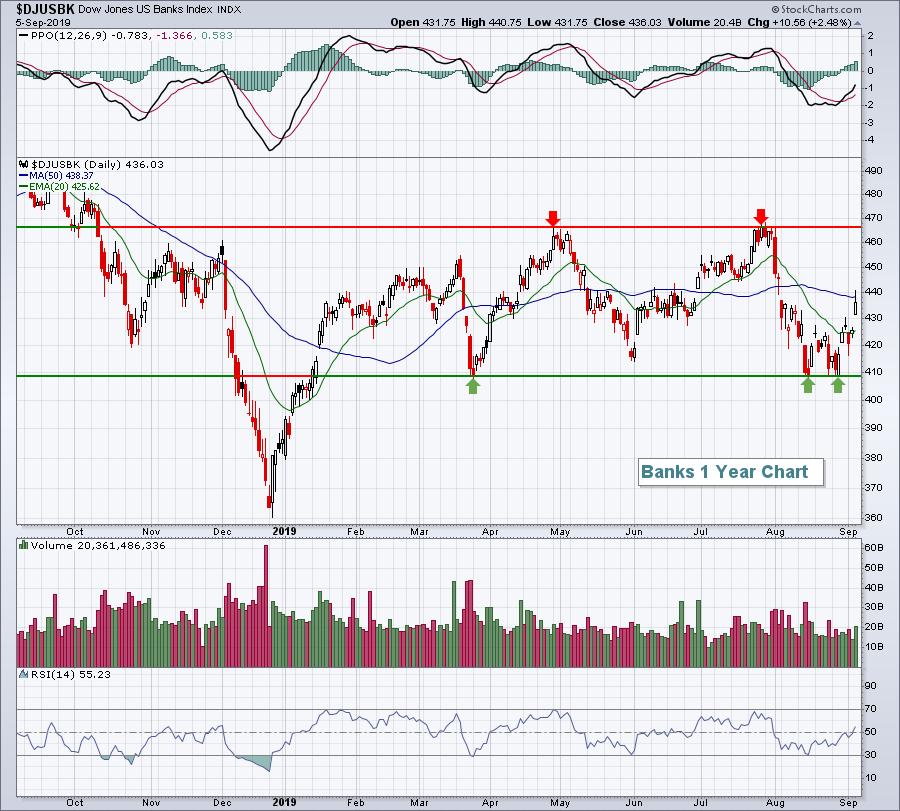
The short-term downtrend was broken with the move back above the declining 20 day EMA. The intermediate-term is more unclear. Yesterday's failure at the 50 day SMA was a bit bearish, but quite honestly, the 50 day SMA has been crossed multiple times in 2019 and really hasn't provided us much of a directional clue. The real key with this group going forward will be which way we break from this wide trading range between 410 and 465. The movement in the 10 year treasury yield ($TNX) will likely provide us the best clue as the DJUSBK tends to move in the same direction as the TNX.
Key Earnings Reports
None
Key Economic Reports
August nonfarm payrolls released at 8:30am EST: 130,000 (actual) vs. 163,000 (estimate)
August private payrolls released at 8:30am EST: 96,000 (actual) vs. 150,000 (estimate)
August unemployment rate released at 8:30am EST: 3.7% (actual) vs. 3.7% (estimate)
August average hourly earnings released at 8:30am EST: +0.4% (actual) vs. +0.3% (estimate)
Happy trading!
Tom


