That answer depends on your trading strategy quite honestly. Day traders likely don't care too much about technical indications on weekly charts whereas longer-term investors probably aren't going to grow too concerned by looking at charts day-to-day. Having said that, I put a lot more weight on the weekly charts. That provides me the big picture that I base my shorter-term trading strategies off of. Let me give you an example by looking at the Dow Jones U.S. Specialized Consumer Services Index ($DJUSCS). The daily chart makes me much more nervous than the "big picture" weekly chart. Here's the daily chart first:
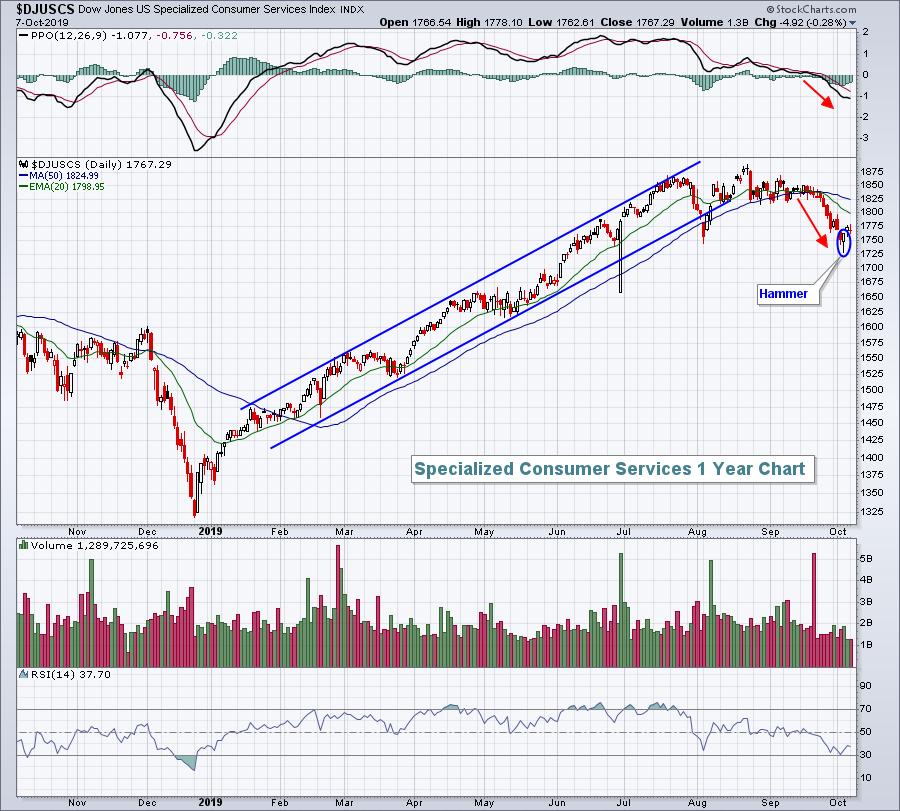
The DJUSCS was in a very tight channel throughout much of 2019, but the chart clearly has rolled over. The PPO has turned negative and pointing lower, which suggests accelerating selling momentum. We've also seen a "death cross", with the shorter 20 day EMA crossing below the longer 50 day SMA. RSI has reached 30 and that doesn't usually happen during uptrends. When I look at the daily chart, I see one that is broken.
But here's what the weekly chart looks like:
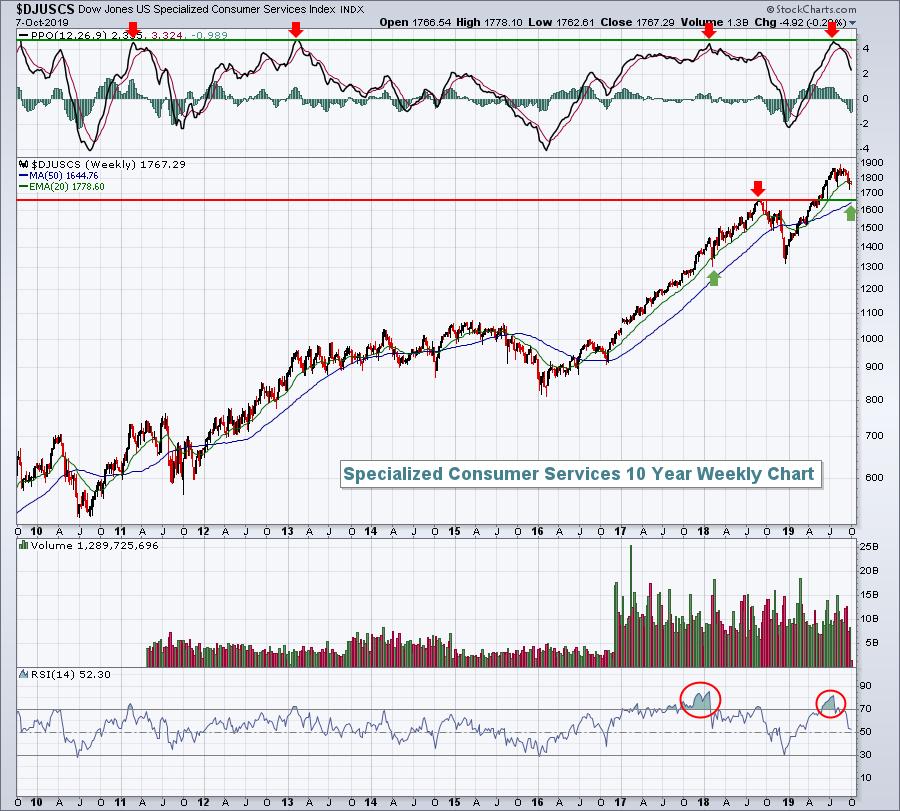
The picture here is much different. The weekly chart recently reached an incredibly overbought level, one where the weekly PPO nearly hit 5. A look back at the last 10 years shows that a PPO level of 5 has been difficult to sustain and that's where we've historically seen some selling and/or consolidation. Also, note that the weekly RSI moved above 80 at the recent price high. It was very overbought and needed some relief, which is what we're getting. Finally, the breakout above price resistance just below 1700 now should provide excellent price support on any further selling.
Two different time frames produce two completely different lines of thinking. My conclusion here is that, while I maintain a bullish longer-term bias on the DJUSCS, I recognize the potential for further short-term selling until major price support is reached. Whether the DJUSCS ever reaches the sub-1700 level in the near-term is obviously quite dependent on the direction of the overall benchmark S&P 500.
I'm cautiously bullish the group currently.
If you haven't joined me for my new show, Trading Places LIVE, please do so. Trading Places LIVE is broadcast on StockCharts TV on Tuesdays and Thursdays from 9:00-9:30am EST, just before the stock market opens. CLICK HERE and join me at 9am EST this morning!
Also, please don't forget to sign up for my FREE EB Digest newsletter, which I publish 3x per week on Mondays, Wednesdays, and Fridays. The focus is on earnings (past and upcoming) and relative strength. With earnings season beginning this Friday with Citigroup (C) reporting, you don't want to miss it! Tomorrow morning, I'll give you my prediction of C's earnings and market reaction. SIGN UP HERE to get your free subscription started!
Happy trading!
Tom


