I generally look to prior price highs in determining overhead resistance, but in the case of all-time highs, there are none. So where do we go next? From a bigger picture outlook, we can use pattern measurements. Based on the recent ascending triangle breakout, I'd look to 3225 to be a potential area for an intermediate-term top:
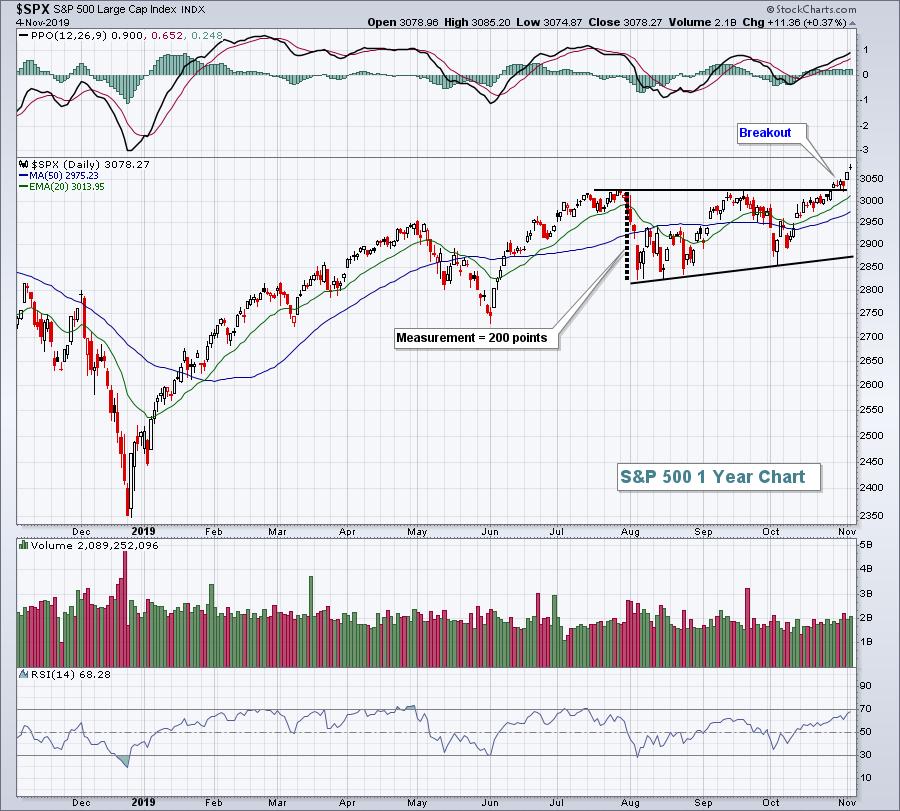
I'd look for an intermediate-term target of 3225, which would represent the breakout level of 3025 plus the 200 point measurement. But it's doubtful we'll go straight from 3025 to 3225, so where might we look for an initial pullback?
I'd rely on a 60 minute negative divergence, similar to those we've seen in recent months:
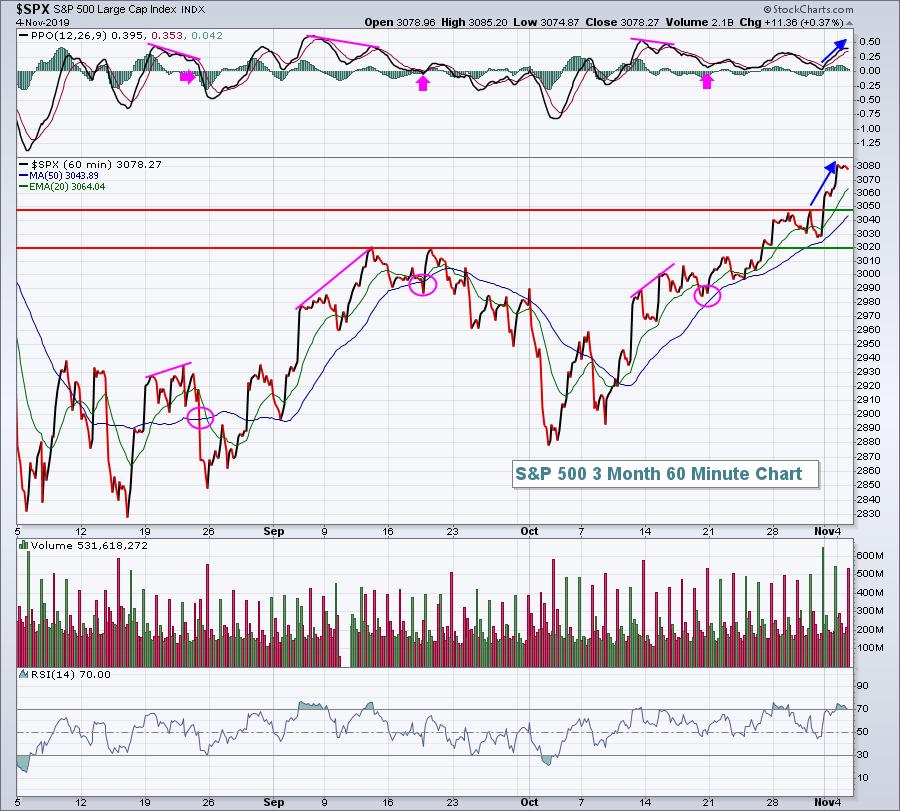
I used a line chart so that it'd be easier to spot those negative divergences (higher highs in price, but lower highs in PPO). These divergences don't guarantee us anything, they simply alert us to the possibility of slowing momentum and a short-term pause in the rally.
Please join me at EarningsBeats.com. I publish a 3x per week newsletter featuring stocks and industry groups that you should be aware of. To subscribe for free, simply CLICK HERE.
Happy trading!
Tom


