Here's today's EB Digest article that I sent to free subscribers close to 8am EST this morning. I just wanted to provide a sample of what you'll get if you SIGN UP.
Looking for a Negative Earnings Surprise
I've been providing a number of earnings-related candidates here in the EB Digest over the last few weeks, many of which have gone on to provide excellent results and outlooks. Tonight, I'll be featuring several companies that will be reporting earnings later this week and show solid relative strength and absolute price charts during a public webinar that's available to all. I'd give them better than 50-50 odds to beat expectations. I'd love to have you join me for this special event.
In the webinar later, I'll focus on companies that I believe will report strong results. For today's EB Digest article, let's check out one stock whose price action suggests a not-so-good report tonight.
Occidental Petroleum (OXY)
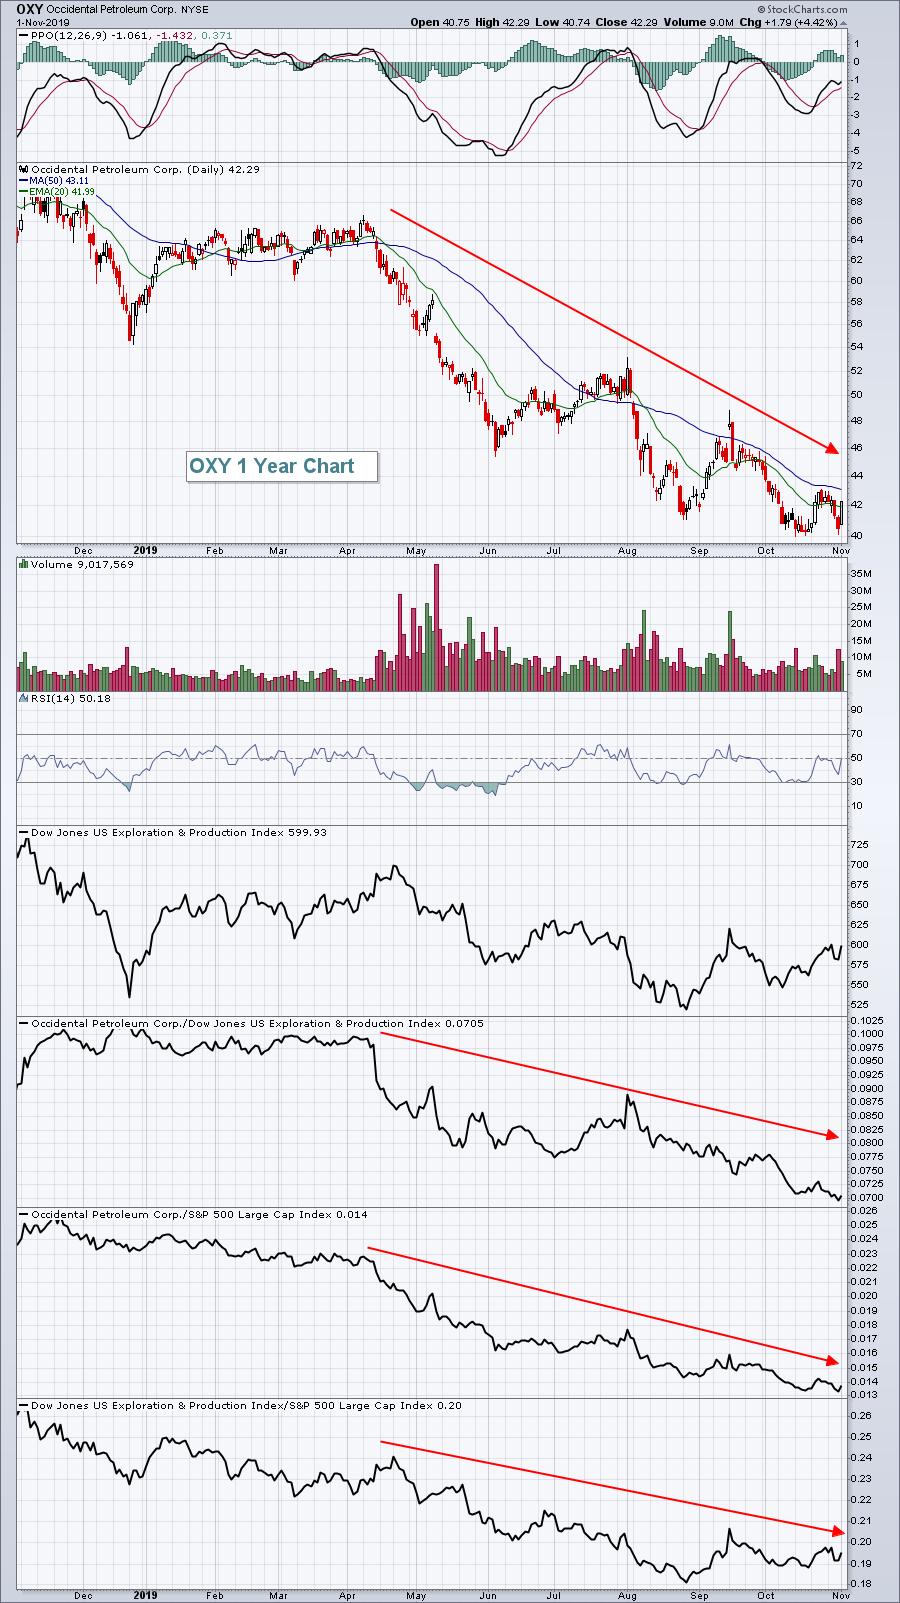
When I see a weak performer in a weak industry, I don't look for much good news with their earnings release. Unlike strong performers that see their relative price charts trending higher, you can see above with the OXY chart that the opposite is true. Wall Street continues bailing on OXY and we should too. There's always that emotion that feels that a selloff is overdone, but just remember that a trend is a trend until it reverses. I wouldn't "hope" that a trend ends - I'd need to see it first.
Tom Bowley, Chief Market Strategist
EarningsBeats.com
"Better Timing. Better Trades."
That's it. It's typically just a quick 2-3 paragraph discussion and a chart that includes panels for relative strength/weakness. Sometimes I include a chart of a company that's set to report earnings - like I did with OXY above. Or sometimes it's an "after the fact" look back at signals that we could've or should've spotted. Or sometimes it's simply pointing out that an industry group is strengthening.
The whole idea behind our EB Digest is education and we'll provide it for you for free. I continue to learn about the stock market every day and you should too.
If you'd like to receive a relative strength or earnings-related chart 3x per week (Mondays, Wednesdays, and Fridays), you can subscribe for free HERE.
IMPORTANT NOTE:
The webinar that I mention above will be held at 4:30pm this afternoon. After providing 15 recent stocks to members that I liked heading into their respective earnings reports (based on volume trends, price charts and relative price charts), the average next day gain among all 15 was close to 5%. After the bell today, I'll feature several more and it's a free event. But we'll be sending room instructions to our paid members and our free EB Digest subscribers. You must be at least a free EB Digest subscriber to receive the room instructions. Make sure you subscribe above.
In the event that you won't be available this afternoon, we'll send out a recording to everyone, so no worries there.
One last thing. My Trading Places LIVE show is Mondays through Thursdays from 9:00am-9:30am EST. On Tuesdays and Thursdays, you can catch my shows on StockCharts TV. On Mondays (today) and Wednesdays, you can follow this link (it's free to all):
Thanks and I hope to see everyone later today!
Happy trading!
Tom


