The volatility has been extreme and the back and forth action has been dizzying at times. But there have been a couple common denominators throughout this 7-8 week up-and-down roller coaster ride that allow us to improve our odds of trading success. And all the tools you need are right here at StockCharts.com. I rarely leave the site. Seriously, from a technical perspective, all the tools necessary to succeed are right in front of us.
Overnight, Gilead Sciences (GILD) reported very good news that its Remdesivir drug appears to be working to treat COVID-19 symptoms. In a Chicago area hospital, it was reported that patients with severe COVID-19 symptoms were seeing rapid recovery after being treated with the GILD drug. That is excellent news! But it's still too early and perhaps too small of a sample to grow overly optimistic. Nonetheless, stock futures are up substantially this morning and that's on top of what already has been a significant rally off the March 23rd bottom. Please keep one thing in mind and I've been saying this all along. We are in a secular bull market. You can pick your spots to try to short this market, but your timing better be right, you need to find the right stocks to short and, most importantly, be sure to keep stops in place.
Here are the two themes that have been carved into stone during this crisis:
Opening Gaps Are The Killers
More than 100% of the net decline since the February 19th top has been the opening gap. Argue with me if you'd like, but I blame the overhyped media for much of this. Yes, the virus is real. Yes, it is most definitely a very serious health crisis. I've never said otherwise. But the media has flashed the most terrifying headlines since COVID-19 cases began being reported in the U.S. I've seen this market decline compared to the Great Depression on many occasions. That is a fear-mongering tactic. The New Deal resulted from the Great Depression. We saw the Securities Act of 1933 and the Securities Exchange Act of 1934 enacted as a result of the Great Depression. Our markets at that time were largely unregulated so fraud and manipulation ran rampant. That led to ridiculous excesses, which also coincided with the end of an extended expansive economic cycle. It all came crashing down. The best comparison to the Great Depression that I could give would probably be the dot com bubble where companies that had no earnings were overhyped and investors were giving them all the money they wanted in return for empty promises, no earnings, and multiple stock splits. That group of dot com bubble stocks crashed similar to stocks in the late-1920s. But the bull market of 2020? There's absolutely no comparison whatsoever. We're still in the early phases of the breakout of the secular bear market that haunted us for 13 long years. Think about this for a second. The S&P 500 double topped near 1550-1560 in 2000 and 2007. At our panicked low in March, the S&P 500 fell back to 2191, only 40% or so above our 2000 market high. That's nuts. When we cleared that double top in 2013, it began what I believe will ultimately lead to two decades of better-than-average stock market performance. Yep, two decades. We'll have cyclical bear markets along the way, but in time, the COVID-19 cyclical bear market will be in our rear view mirror much the same as the 1987 crash was during the two decade secular bull market of the 1980s and 1990s.
So let's get back to my original point. During this crisis, the S&P 500 has gapped lower often, but think about this stat for a second. Since the February 19th close, the SPY has traded as follows:
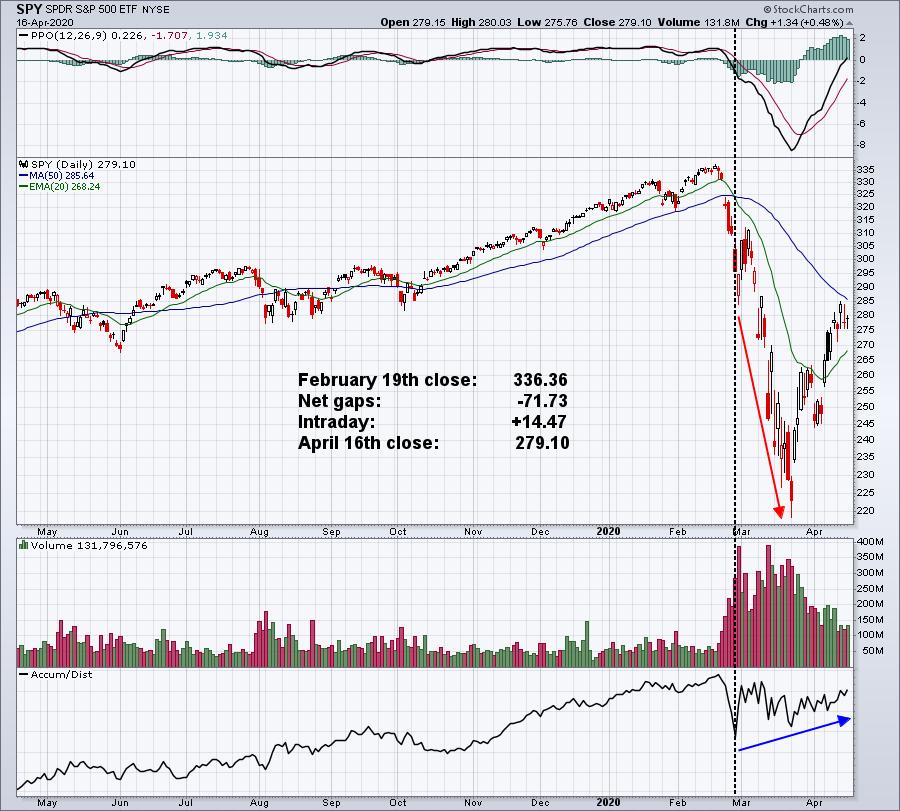
This chart clearly screams two things. First, much of this hysteria and panic-induced selling occurred at the opening bell. From 9:30am EST to 4:00pm EST, it was if nothing was really happening. Does that look like mass distribution to you? It doesn't to me. Second, check out the accumulation/distribution line. That was the real eye-opener for me. That's when my CPA/analytical background in me decided to look much more closely at what was being accumulated and what was not. It was quite apparent and that leads me to my second point in this article.
Institutions Have Been Accumulating While Individuals Sell
Let me first say that institutions have also been sellers of areas like airlines, cruise lines, hotels, gambling, travel & tourism, etc. Those groups have shown confirming signals of mass distribution. But many areas have been aggressively bought and accumulated and that's where most analysts have gone wrong. Many stocks and industry groups have thrived during this pandemic if you're willing to do the research to find them. Go back to that SPY chart for a moment and check out that black-dotted vertical line at the end of February. That's where the game changed. We ended February with a heavy volume, hollow candle. Hollow candles form when we see a close above the open. It's also a potential sign of accumulation since theoretically it would require more buyers than sellers after the opening bell in order to see a close above the open. During the massive March decline that led to the March 23rd bottom, look at the rising accumulation/distribution ("AD") line (blue directional line) on the SPY. That's what got me started in developing a "Strong AD ChartList" and a "Weak AD ChartList". I wanted to separate those stocks being accumulated (bought) vs. those being distributed (sold). The results are nothing short of amazing. I want you to see how these two very different subset of stocks performed on Thursday, April 16th on a day when the S&P 500 gained a mere 0.58%.
CLICK HERE to see a stat summary of how these two distinct ChartLists performed and I believe it will help you to understand what's been taking place in the stock for the past 45 days.
Happy trading!
Tom


