First, welcome to August! It's hard to believe that we're into our 8th month of 2020. It's been a very difficult year on a number of fronts, but I hope that EarningsBeats.com has at least been able to help you navigate through the financial mess that we've had to endure. Perhaps the most critical part financially was recognizing throughout this pandemic that this downturn was a cyclical bear market, as opposed to a secular bear market. For those not understanding the difference, a cyclical bear market refers to a much shorter period of selling. A secular bear market is what we endured from 2000 into 2013, where it literally took us 13 years to finally clear the 2000 and 2007 price highs on the S&P 500.
We're in a secular bull market, which is a long-term bull market. Secular bull markets can endure several cyclical bear markets, just like the two recently - the Q4 2018 trade-related meltdown (-20% in 3 months) and the February/March 2020 pandemic (-35% in 1 month). Secular bull markets also endure recessions. During the two decade secular bull market in the 1950s and 1960s, there were a handful of recessions. Calling major bottoms is never an easy thing to do, especially in the heat of the battle with the VIX skyrocketing. I have to say that I find it entertaining when analysts now come out and say "we believe the bottom is in". It's actually more helpful to call it when it happens, because I don't know anyone who can actually invest in their rear view mirror months later. I've studied the market from a historical perspective for decades. While no two bottoms are exact, there are common denominators and extreme fear is one. In my March 13th article in ChartWatchers, "Extreme Bearish Sentiment Is Marking A Bottom", I discussed the likelihood that we were seeing the "kitchen sink" being thrown in. I suggested that we might see one more low (which we did a little more than a week later), but the Volatility Index ($VIX) at 75 was a MAJOR clue that the end of the selling was rapidly approaching. So Step 1 in being a successful investor is knowing and understanding history, especially where it relates to major bottoms and how they form.
I am absolutely convinced that we're in a secular bull market and that we'll see wildly higher equity prices globally for the next decade. The strength will come from asset class rotation. Bonds are incredibly overbought and now investors have a choice to make. Do you want to buy a 10 year U.S. treasury note yielding 0.54% or do you want to own Apple, Inc. (AAPL), which just posted quarterly results that absolutely torched Wall Street consensus estimates? AAPL's yield of 0.85% easily tops the 10 year treasury yield, PLUS you get AAPL's capital appreciation. It's a no-brainer. I'm pointing out AAPL, because it's an obvious choice over treasuries, in my opinion. But there are hundreds of others and this historically-low interest rate environment values earnings growth (and especially the acceleration of earnings growth) much, much higher than it would have two decades ago, when rates were several percentage points higher. PEs should be at all-time highs for companies delivering strong earnings growth. Stop thinking PEs shouldn't go above 20. We are in a period unlike any in history. When were interest rates near zero and the Fed saying they'll stay there for 2 more years? Many companies, especially in technology, are CRUSHING revenue and EPS estimates. They should command stratospheric earnings multiples. Just wait until the fundamentalists see the upcoming PE ratios. They'll be screaming the market is overvalued for years and will sit it out.
This environment leads to our professional-quality research at EarningsBeats.com. I pride myself on helping thousands of investors around the globe. I try to pass on all the things I've learned over the years in much the same way that I learned intermarket analysis from John Murphy. I haven't written a book, mostly because I simply don't have the time. But the countless hours that I pour into our research at EarningsBeats.com, the TV shows at both Stockcharts.com and EarningsBeats.com, the blog articles, and our primary service - I believe this is the best way to give back.
So...speaking of our research, I want to discuss our 6 pillars, which are simply our 6 ChartLists that we regularly update for our members. Here's a brief description of each:
Strong Earnings ChartList (SECL):
This is our flagship research product. I created our SECL in Q4 2013 and began trading almost exclusively from it at that time. It has powered my own results and we receive tremendously positive feedback from our members. Companies on our SECL must meet 3 key criteria. First, in their latest quarterly earnings report, they MUST have beaten both revenue and EPS estimates. Matching isn't good enough. We want companies to beat, because those are the companies most likely to see estimates revised higher in future quarters and they're also likely to be granted higher valuation multiples by Wall Street. Next, they must be liquid and typically at least $1 per share. For liquidity, we won't consider companies that don't trade at least 200,000 shares per day. While individually you might be fine with companies that trade quite a bit less than that, remember that EarningsBeats.com has a large community of investors and traders, so we don't want to suggest a stock that could run into liquidity issues. 200,000 shares is just a rule of thumb for us. Finally, there must be bullish characteristics of some sort on the chart. We want to see a positive reaction on high volume, or excellent relative strength among its peers and the benchmark S&P 500. If companies don't meet this three criteria, they don't find their way onto our SECL. During earnings season, this ChartList typically contains anywhere from 150 to 350 companies.
Frequency of update: 2-3 times per month
Example - CHGG:
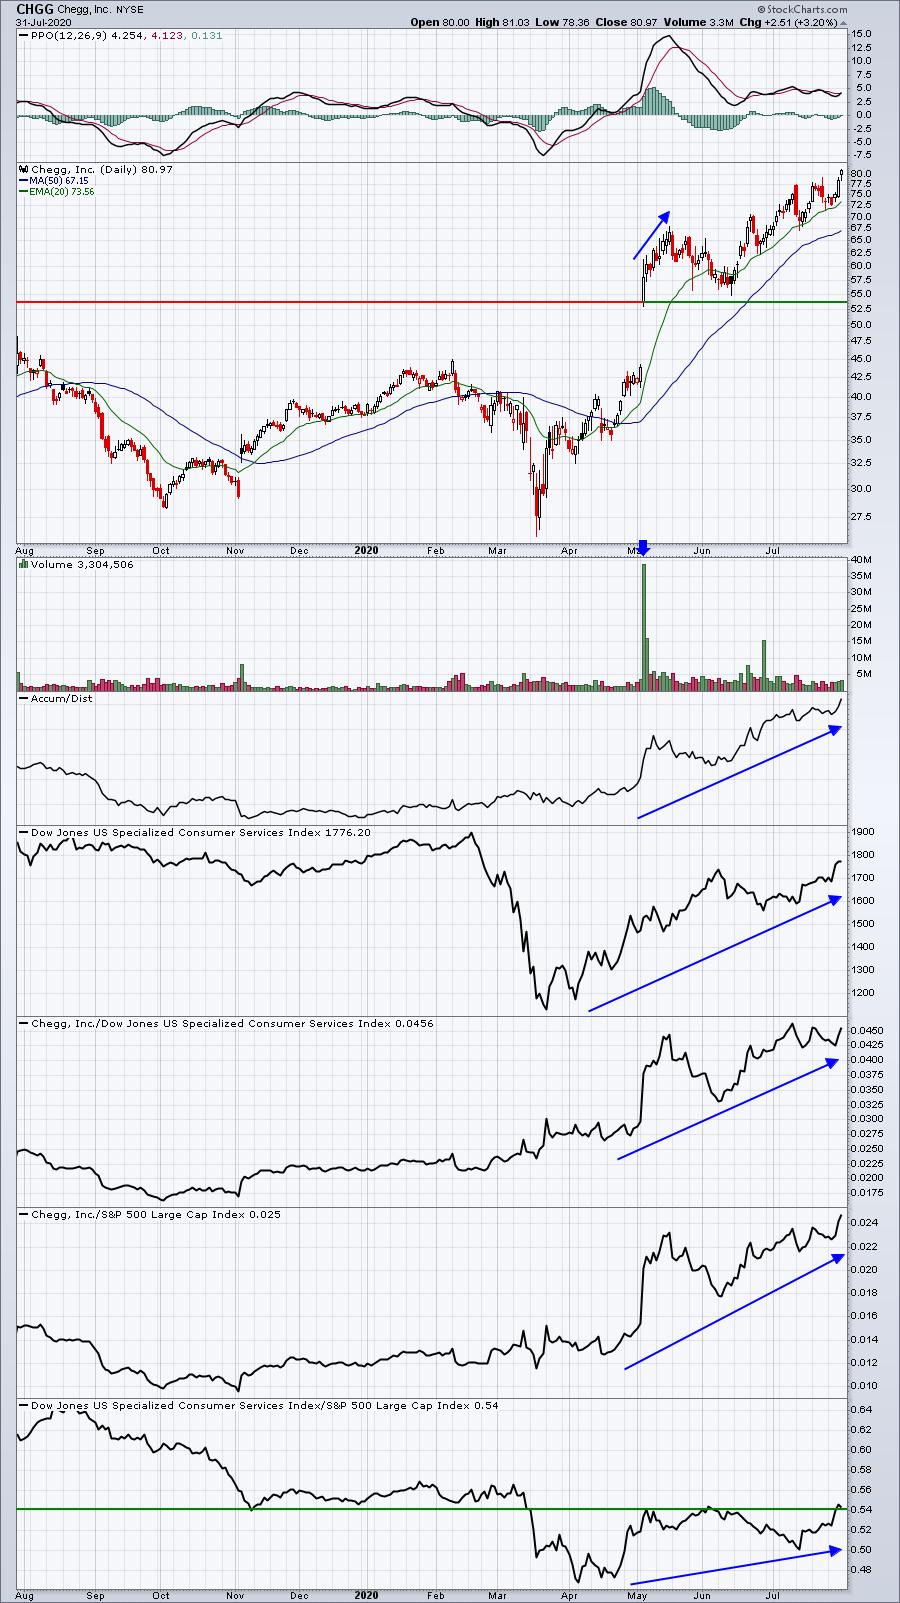
Check out that early May volume that accompanied this huge move up in CHGG. The stock continued racing higher for the next several days. We add a company like this to our SECL and then simply wait for it to approach a much better reward to risk entry. One of our scanning strategies is to look for companies with an RSI between 40 and 50 as this level of RSI tends to coincide with bottoms on uptrending stocks. The RSI is not pictured in the above chart, but CHGG's RSI moved below 50 in the 2nd week of June as that bottom formed. This is a perfect example of what we do with our SECL. Fill it with companies having both excellent fundamental and technical strength and then WAIT for a better entry opportunity.
Strong Future Earnings ChartList (SFECL):
This ChartList is fairly new and serves as a complement to the SECL. The key here is that companies must have solid relative strength. Where earnings are the primary focus on the SECL, I'd say that relative strength is the primary focus here. Companies must have a SCTR score of 80 or above. Companies that do not have SCTR scores are evaluated individually. We also are focusing on the strongest industry groups. So perhaps to sum it up best, we want the leading stocks in the leading industry groups - that are NOT already on the SECL. As a company approaches its earnings date, it is removed from the SECL. If that company remains a strong relative performer in a solid industry group, it likely will be simultaneously added to our SFECL.
Frequency of update: 2-3 times per month
Strong AD ChartList (SADCL):
Our Strong Accumulation/Distribution ChartList (SADCL) and Weak Accumulation/Distribution ChartList (WADCL) were borne out of the pandemic. While media-induced panic was creating massive gap downs among most stocks back in March, performance during the day was quite bifurcated. Many stocks were gapping down, but then being accumulated during the session. Others were gapping down at the open and continuing to sell off during the day. This divergence was noted very early and these two ChartLists were created in April to make our members aware of the safer stocks to trade on the long side (SADCL) vs. the weaker stocks to avoid or short (WADCL). The SADCL continues to crush the performance of the WADCL as you can see in a table later in this article.
Frequency of update: the original list of Strong AD stocks is being maintained as they continue to provide excellent signals and their outperformance of the Weak AD stocks continues through today.
Example - CDNS:
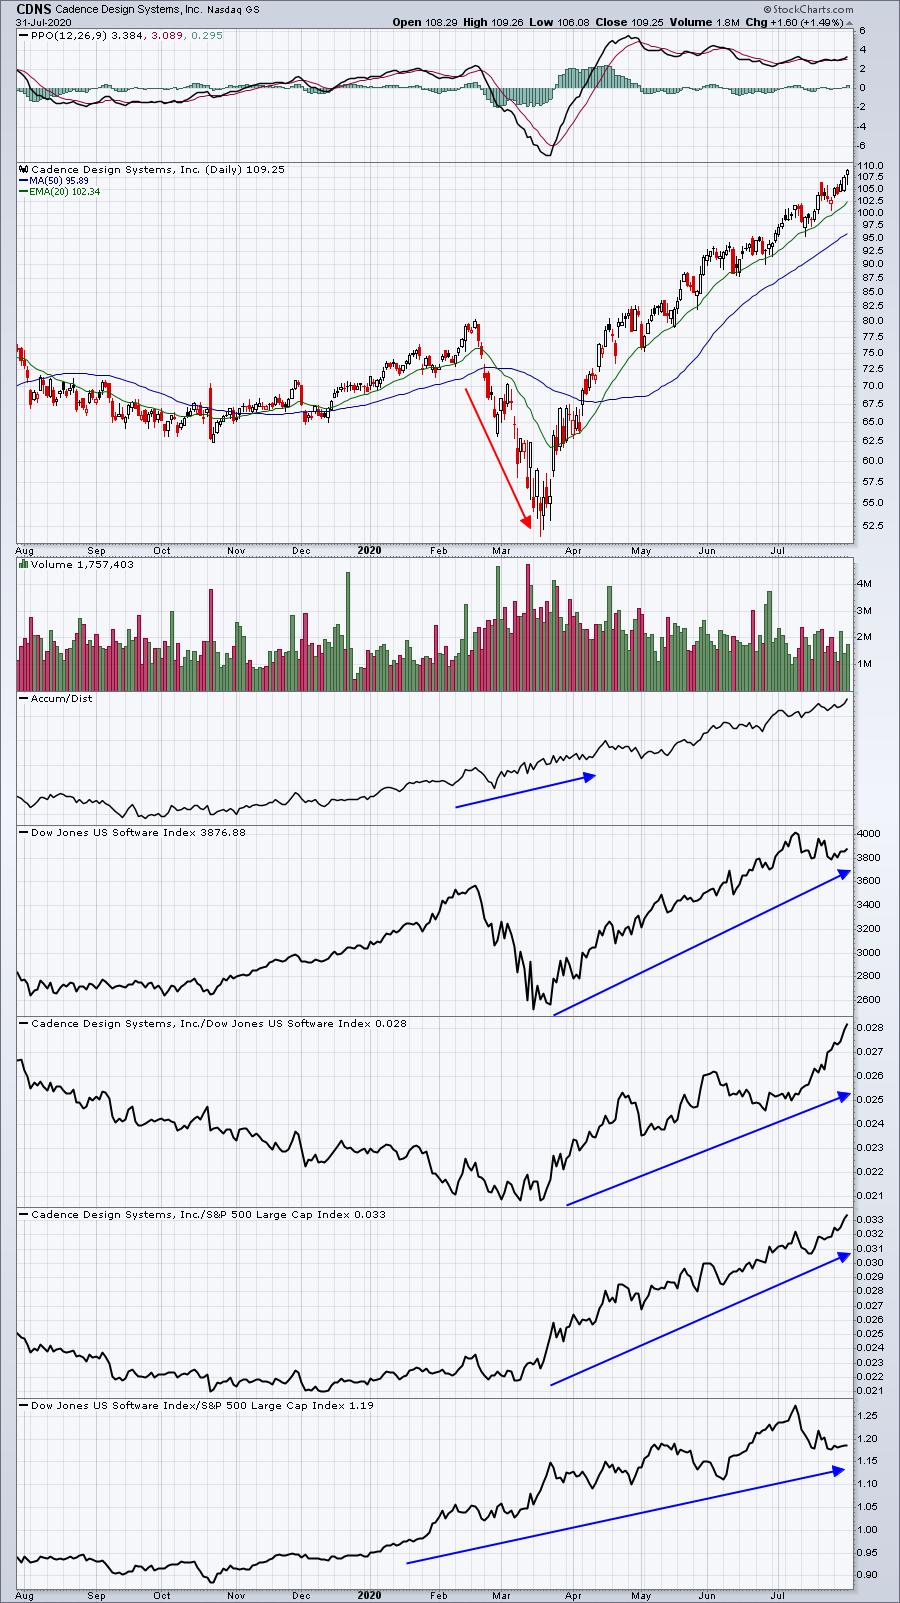
Focus on the March/April behavior. While price action was moving lower on CDNS back in March, do you see the AD line rising to new highs? That's how a stock got on this ChartList back in April. AD lines only consider what happens during the trading day. There's no consideration whatsoever relating to the opening gap or the prior day's close. So if a stock opened down 5%, but then rallied throughout the day, the AD line would go up even if the stock still closed down say 2% for the day. That's the primary difference between the AD line and On Balance Volume (OBV) and why I believe the AD line was so much more effective than the OBV throughout this pandemic.
Weak AD ChartList (WADCL):
This ChartList was intended to provide our members with shorting candidates, as described above.
Frequency of update: the original list of Weak AD stocks is being maintained as they continue to provide excellent signals and their underperformance of the Strong AD stocks continues through today.
Example - BA:
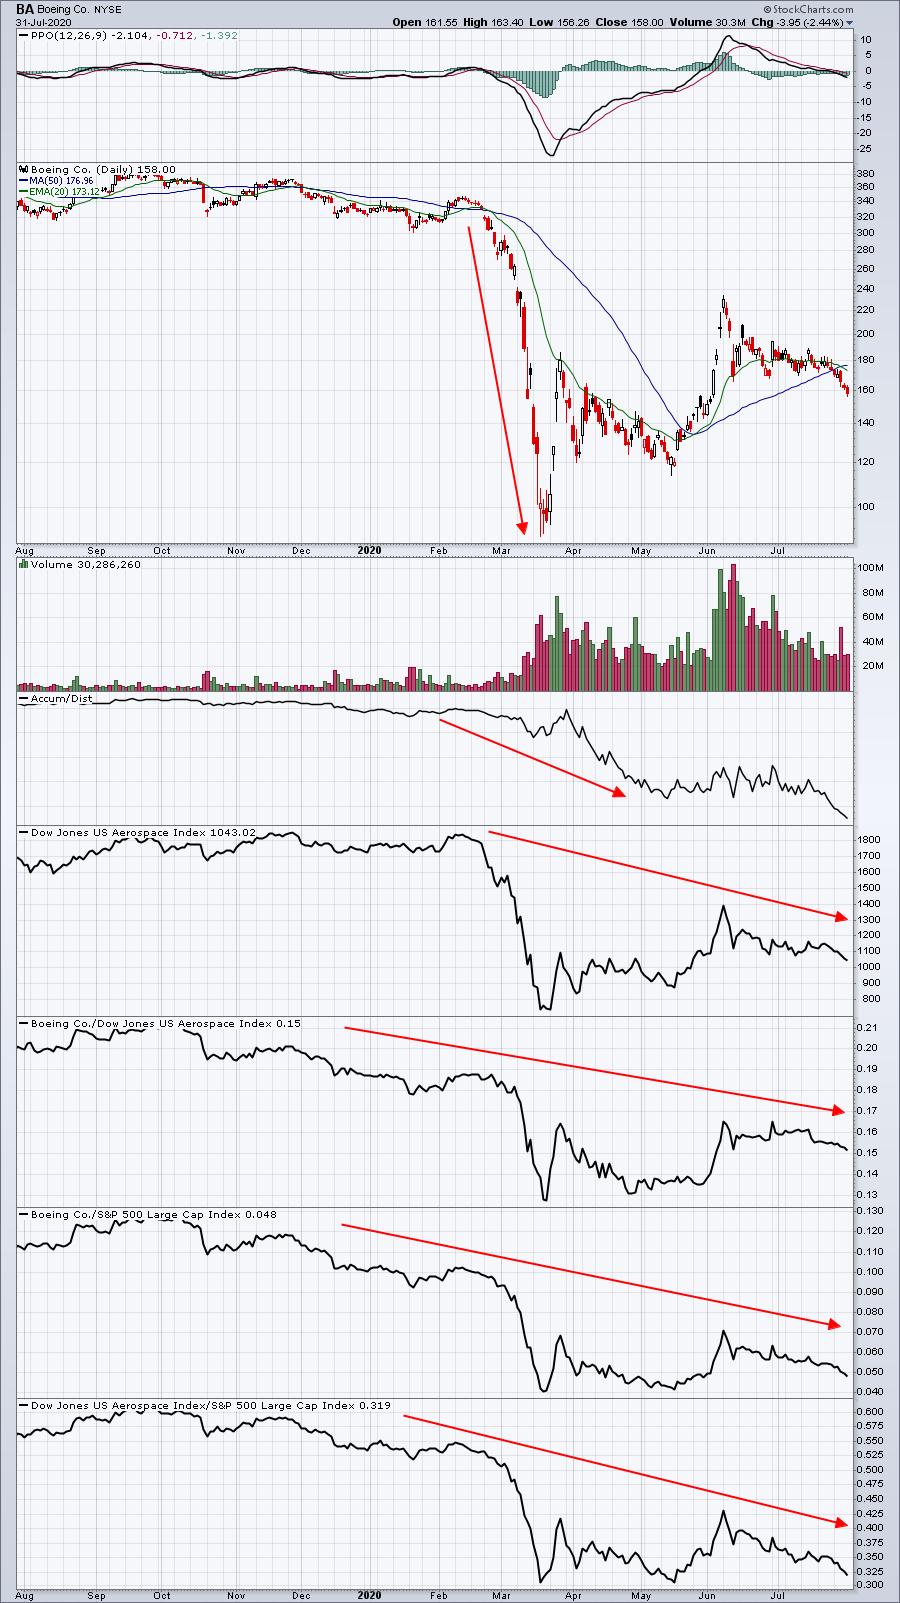
I think the difference here is rather clear. Not only did price action move lower in March, but the AD line also moved lower. In fact, the downtrend in the AD line, along with several price relative lines, continues to move lower.
Raised Guidance ChartList (RGCL):
Within the last month, this new Raised Guidance ChartList (RGCL) was created to identify those companies that raised guidance in the past quarter. We had received questions from members asking if we considered forward guidance when we add companies to our SECL. That contributed to the decison to create this new ChartList. The criteria for making it onto this list is still evolving as we evaluate its performance, but obviously companies must raise guidance to be considered for inclusion.
Frequency of update: I expect that we'll be updating this ChartList once per month.
Example - BIG:
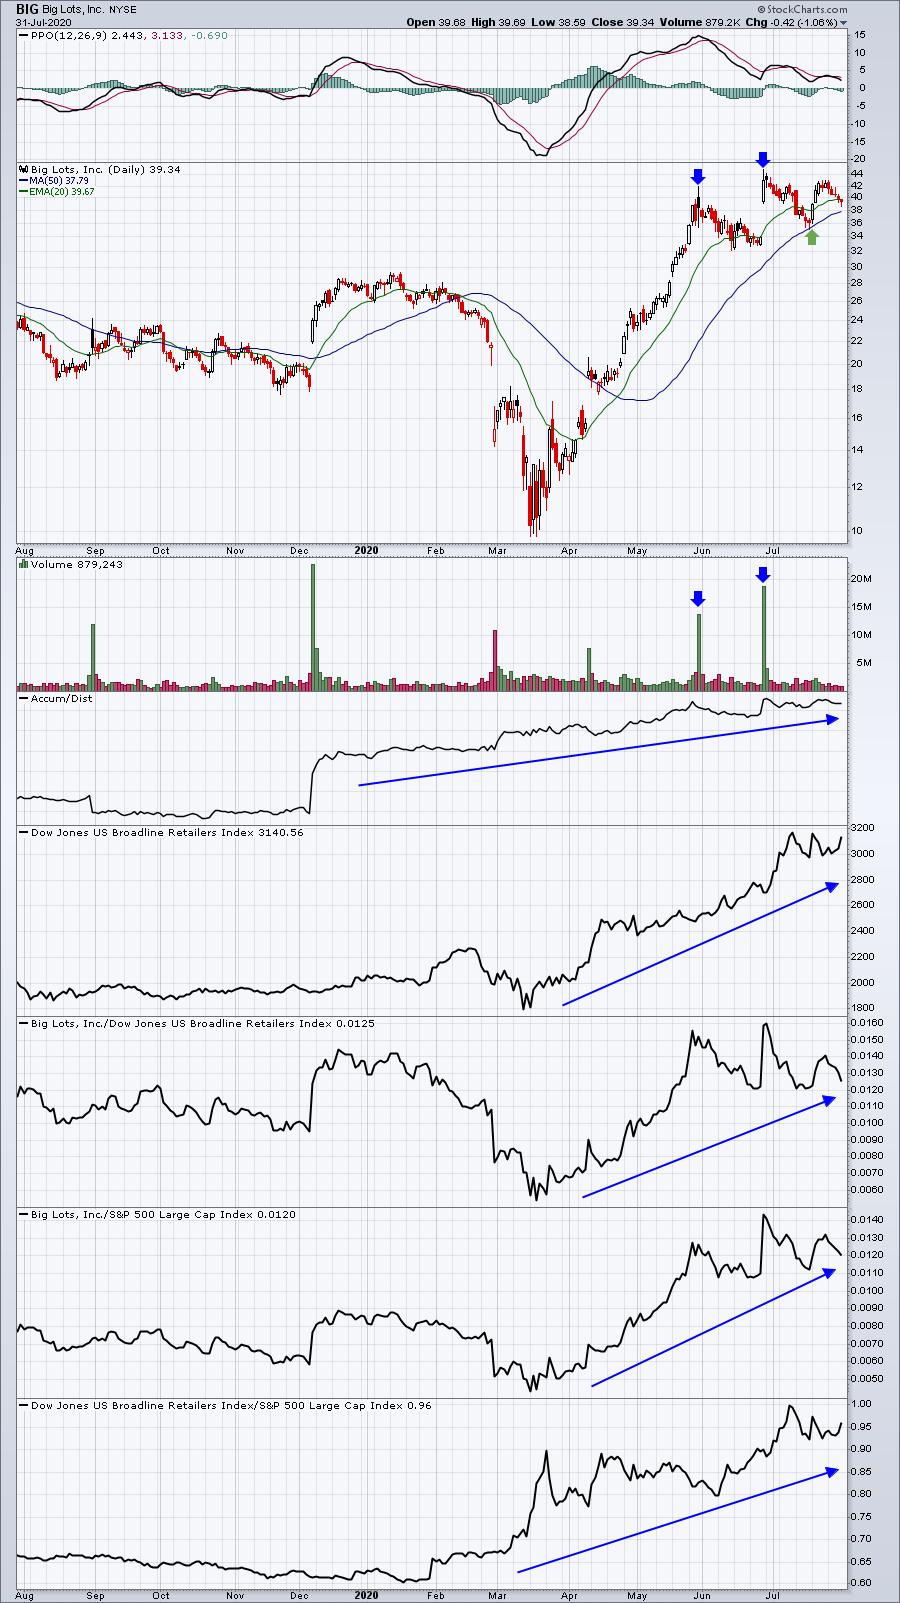
The two blue arrows highlight two different times where BIG raised guidance this past quarter. We don't want to chase, however. Let the stock come back to us. On July 20th, I wrote a Don't Ignore This Chart blog article about BIG and how "Raising Guidance Can Result In A BIG Advance". That article proved to be very timely as BIG gained 15% in just two trading days.
Short Squeeze ChartList (SSCL):
This is a powerful ChartList. Most stocks on this ChartList are weak and should not be considered for long trades. However, those that break out and begin to show relative strength can result in massive gains over short periods of time. To be included on our SSCL, companies must have a short percentage of float of at least 20%. High short levels represent guaranteed buyers. When a stock breaks out and is showing relative strength, we will typically see technical buyers become interested AND then short sellers must begin to consider how much pain they're willing to take. It becomes very emotional and can lead to panicked buying, sending shares rising very quickly.
Frequency of update: Once per month
4 of our current 92 stocks on this ChartList gained over 100% during the month of July, which proves our point. When a heavily shorted stock breaks out, the advance can be very quick and powerful.
Example - BGFV:
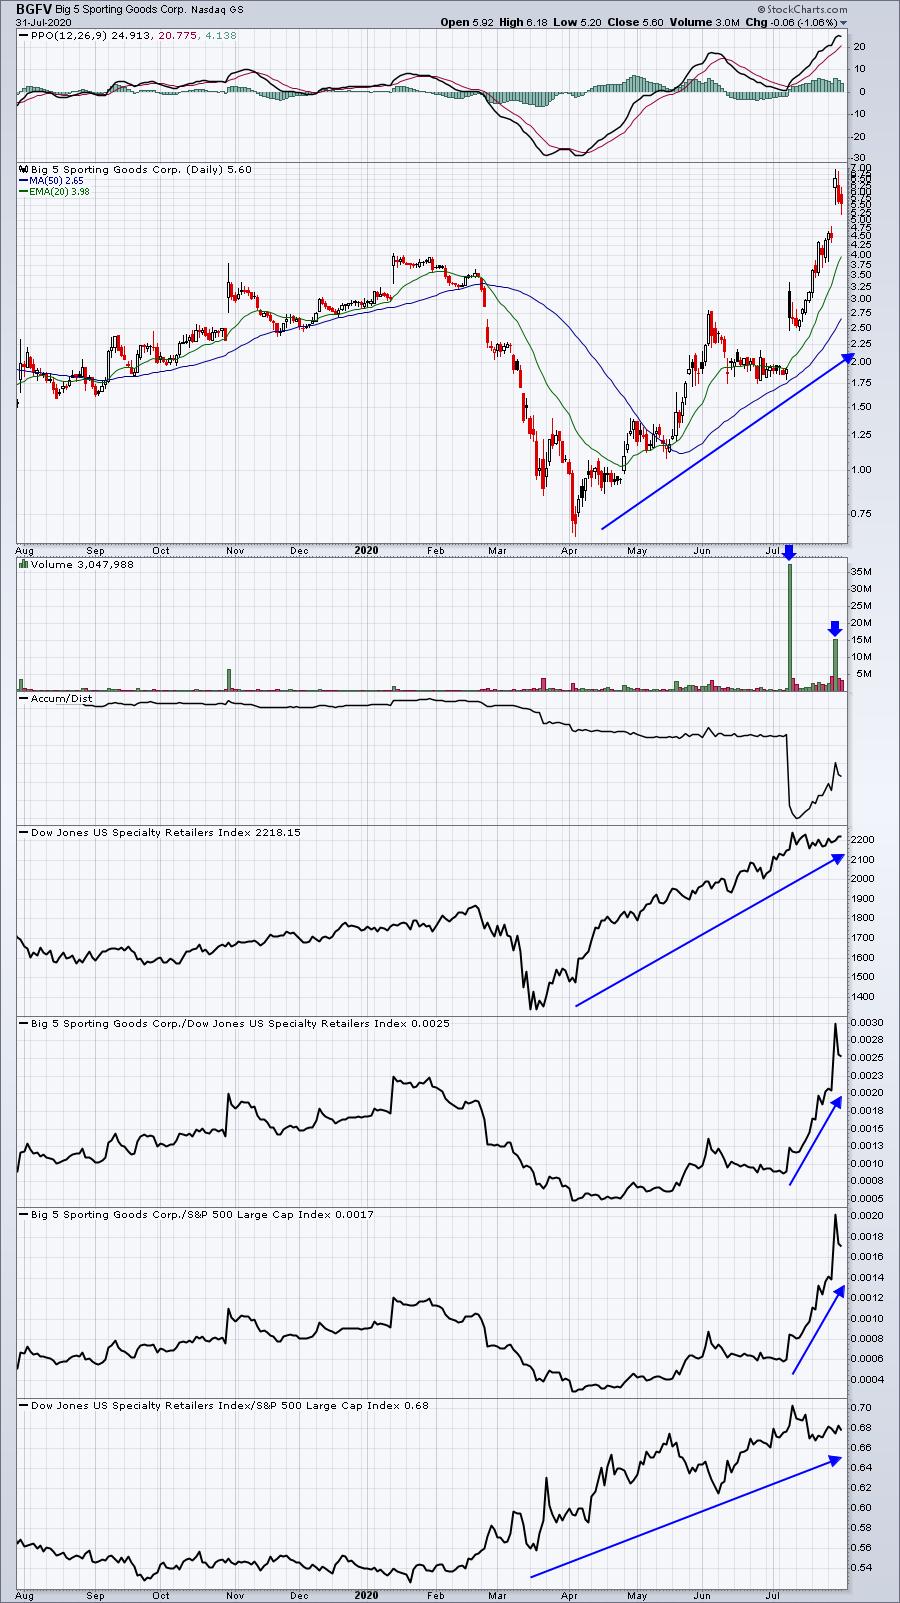
In the last month, BGFV has gained 188%. It's no doubt been fueled by a truckload of short sellers running for cover. Check out the volume on its advance! Many times short sellers will be right about a stock, which is why I wouldn't rush into our Short Squeeze ChartList and start buying stock after stock. But isolated breakouts where short sellers get it WRONG can result in breathtaking returns. Of course, these stocks will be much more volatile than many stocks, so it's not likely a great strategy for everyone. But those with a high risk tolerance will likely LOVE this ChartList.
So that's it - our 6 Pillars or ChartLists. There are more than 1300 charts on these 6 ChartLists and we have 5 Scanning Strategies on our website that we routinely use to find great trading candidates every day. In addition, we have our 4 portfolios - Model, Aggressive, Income, and Strong AD - that are mostly crushing the benchmark S&P 500. These 4 portfolios are also in 4 separate ChartLists.
It is so simple, and yet extremely powerful, to download these ChartLists into your StockCharts.com account (assuming that you are either an Extra or Pro level member). EarningsBeats.com members are encouraged to do exactly that. Combining our research at EarningsBeats.com with the amazing tools and features of StockCharts.com will take your investing and trading to an entirely different level. We both have no cost 30-day trials that you can find here:
StockCharts.com 30-day free trial
EarningsBeat.com fully refundable $7 30-day trial ($7 is refunded within a week)
If you're having any doubts, I've recorded a video to show you exactly how you download our ChartLists directly into your StockCharts.com account and I show you how to save our scans. Check this out:
That's a lot of homework and research that you can quickly download into your StockCharts.com at ZERO cost. We are receiving emails from professionals that have given up their prior research platforms and using ours. And it's priced affordably for everyone.
I hope you'll take me up on this excellent offer and try our service today!
Happy trading!
Tom


