We have seen tremendous leadership from the NASDAQ 100 ($NDX) throughout 2020 and the COVID-19 pandemic. Many growth-oriented component stocks have done exceptionally well as they've adjusted to this "stay-at-home" and "social distancing" environment. But is this a paradigm shift that continues into 2021? Or have these stocks run their course? Many would argue that the high PE multiples suggest very overbought conditions and a big correction ahead. Given my background in public accounting and having valued companies before, I understand the huge implications of strong projected growth in a very favorable interest rate environment. Because of this, I'd argue that many of these companies are worth every penny of their current valuations....and maybe more. Granted, if the future earnings growth picture changes for the worst, then growth stocks will be subject to a revaluation and therein lies the risk that many investors, quite honestly, might not be willing to take.
In the short-term, however, I simply follow the charts. If these stocks remain in favor, I want to own them. I'm a momentum trader so I stick with what's working. There's a rotation dynamic that is beginning to play out and will continue to do so given the vaccine news from Monday. I'll definitely be doing my analysis and research, as I did in March and April, to uncover the "under the surface" technical rotation, but from a bigger picture perspective, watch the QQQ, which tracks the NASDAQ 100 index. Right now, the QQQ is in an uptrend and is likely to move higher so long as the following hourly and daily support holds:
QQQ - hourly chart:
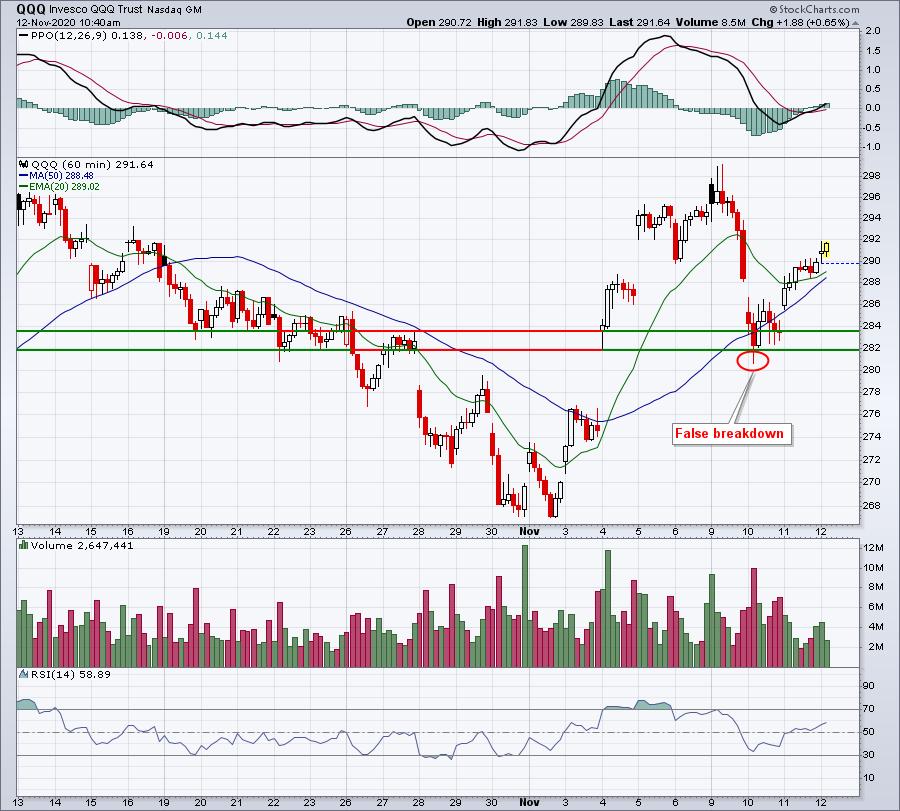
Initially, the QQQ gapped up with the vaccine news, but quickly retreated all the way back to gap support from November 4th, even printing a brief false breakdown. Since then, however, the QQQ is gaining ground and the growth vs. value (IWF:IWD) dynamic has returned to the market. NASDAQ bulls want to see this continue.
QQQ - daily chart:
 Sentiment issues had built up in early September and I wrote about them in my September 3rd article, "2 Sentiment Indicators Are Suggesting Extreme Caution - BEWARE!". That morning, we saw a gap lower and the QQQ opened at 297.77. We haven't closed above that level since. From a bullish perspective, a breakout there would likely result in much higher prices as that would encourage new money to join the party, as well as encourage those that moved to the sidelines to get back in - if they haven't already. Also, the gap support test from November 4th on the hourly chart also resulted in a rising 20 day EMA test on the daily chart. Successful tests at the 20 day EMA are hallmarks during a bull market rally.
So the first big question for me is, "Do we close above 298 or below 282 first?" My second question on a rally and breakout would then become, "Are growth stocks leading the rally and the breakout?".
In addition to these more obvious concerns on the QQQ charts, I am currently researching the rotation between various sectors and industry groups to identify the next batch of relative winners. I'll be discussing this in a FREE webinar Friday morning at 10:00am ET. Bill Shelby, Lead Software Engineer at StockCharts.com, will join me. Bill understands the StockCharts scan engine better than anyone and we'll be discussing how to combine solid research with custom scans to identify potential winning stocks.
If you'd like to join us for this "Advanced Scanning Strategies With Special Guest Bill Shelby", you can register by joining our FREE EB Digest newsletter. There is no credit card required and you may unsubscribe at any time. We will send out room instruction to our entire EarningsBeats.com community, including the EB Digest newsletter subscribers. For more information on the event and to register, CLICK HERE.
Happy trading!
Tom


