We now have 2 years under our belt at EarningsBeats.com with respect to our flagship Model Portfolio and the results have been stunning - quite honestly better than I could have ever predicted or imagined. We had to suffer through a 20%+ drawdown in Q4 2018 (trade war), just after the Model Portfolio's inception, and another 34% drawdown in Q1 2020 (pandemic). Yet here we are, now +200.73% after 2 years and 22 days. Here's an inception-to-date chart:
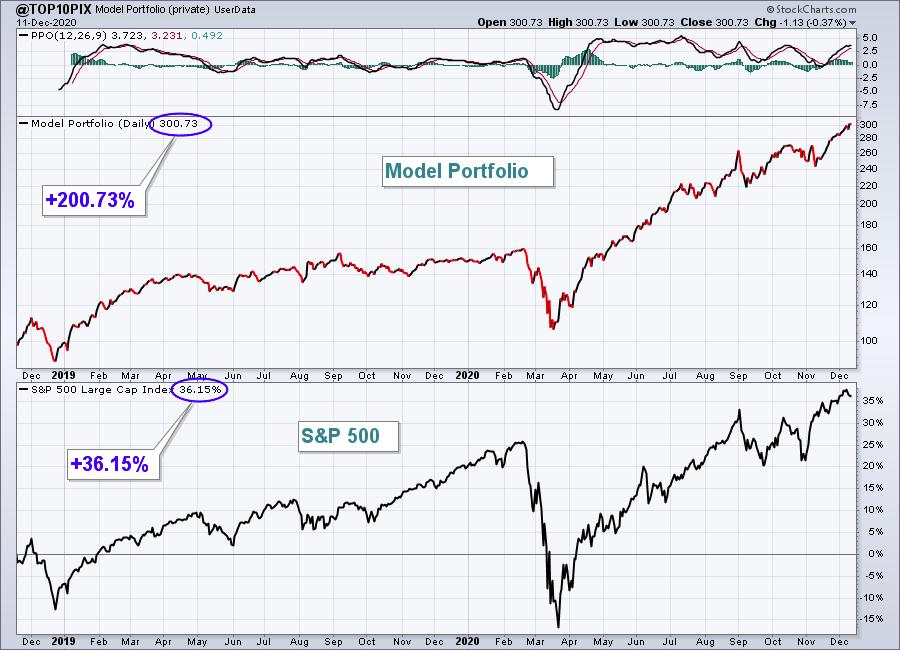
Owning leading stocks in leading industry groups has proven to be a very profitable strategy. After hearing from multiple investment professionals that have been astounded by our results, I decided to calculate our Sharpe Ratio.
What is the Sharpe Ratio?
The Sharpe Ratio was developed by Nobel laureate William F. Sharpe and is widely used to aid investors in understanding the risk undertaken to achieve certain returns. Essentially, it compares the performance of an investment (in our case, a portfolio) to the return of a risk-free asset. That difference, divided by the standard deviation, represents the Sharpe Ratio. In my example, I used the 1-month treasury bill as the risk-free asset and its yield ($UST1M) as the risk-free return.
A Sharpe Ratio of 1 is good, 2 or better is very good, while anything above 3 is generally considered excellent.
Our Model Portfolio
Our results over the past two years have been astounding. Before I discuss our Sharpe Ratio, here are the Model Portfolio's quarterly returns since its inception in 2018:
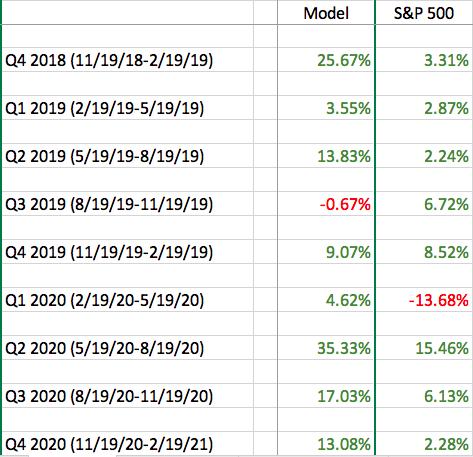
The returns are clearly strong. Our Model Portfolio has outperformed the S&P 500 in 7 of its first 8 quarters, and outperformed by more than 10 percentage points in 5 of those 8 quarters. That's crazy. After a few weeks of the current quarter, we're well on our way to outperforming strongly once again and we're already more than 10 percentage points ahead of the S&P 500 after just three weeks!
But is the risk worth the return?
Before I answer this, I want you to take a look at the Model Portfolio chart that I posted earlier. When the S&P 500 sells off, the drawdowns are essentially the same as the S&P 500, but when the S&P 500 moves higher, the Model Portfolio crushes it. That's been the history. I knew the Sharpe Ratio would be good, but I wasn't sure how good. Like the Model Portfolio's returns, its Sharpe Ratio exceeded my wildest dreams as well. Here they are by quarter:
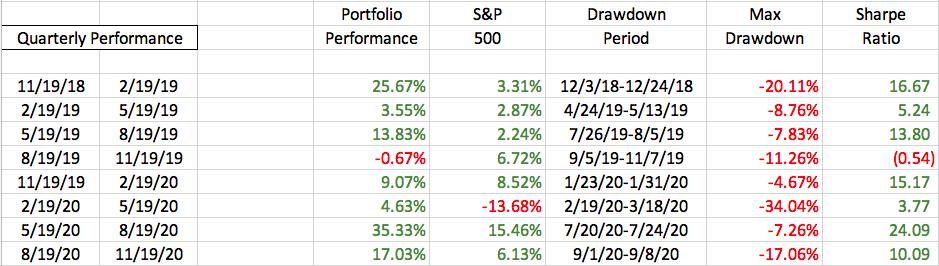
When I calculated the Sharpe Ratio on an annual basis, the two years were strikingly similar. We had a Sharpe Ratio of 9.85 in our first year and 9.86 in our second year. Keep in mind that any Sharpe Ratio above 3 is considered an excellent return for the risk taken.
We do charge our "professional" members (those who manage money for others) at a higher rate than our individual members, but I'd be happy to provide any professional a special holiday offer. Simply write to me at "tom@earningsbeats.com" and provide me your firm and your firm email address and I'll get back to you. I'd love for you to try our service as we begin a brand new year, one that I believe will provide us excellent opportunities ahead.
Happy trading!
Tom


