U.S. equities are doing what U.S equities normally do. They're rising as we approach earnings season. I wrote a ChartWatchers article recently, "Wall Street Doesn't Want You To See These S&P 500 Performance Numbers", summarizing the typical pre-earnings outperformance. Be sure to check it out, if you haven't already.
Over a lifetime, stock investing is better than any other investing. But it's all the noise and constant negativity that's the true battle we must conquer. There is always a reason why stocks shouldn't be performing well and why the market is overpriced. Blah, blah, blah. We had another solid advance last week with the S&P 500 rising 1.7%. The NASDAQ did even better, gaining 1.94%. Perhaps the most bullish part was the sector breakdown last week:
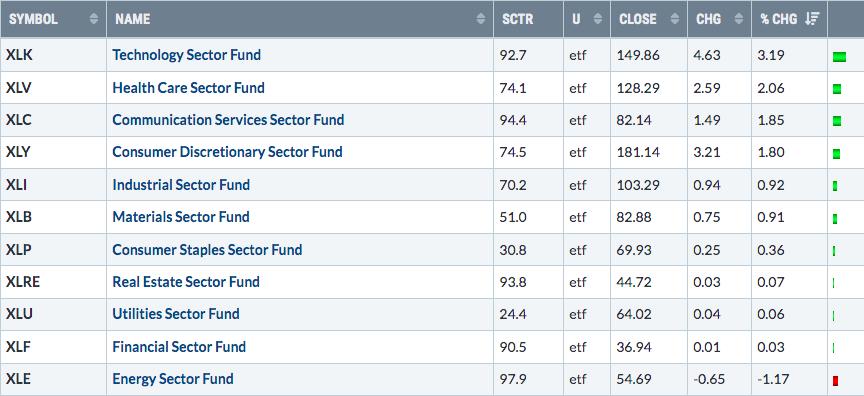
Energy (XLE) was the only sector to move lower. The remaining sectors to underperform were primarily the defensive sectors - utilities (XLU), real estate (XLRE), and consumer staples (XLP). Financials (XLF) ran into difficulty, mostly due to the deteriorating 10-year treasury yield ($TNX), which fell throughout the week. The TNX ended the week at 1.43%, its lowest close since March 2nd. Declining treasury yields typically have negative effects on many areas within financials, including banks ($DJUSBK, -0.83%) and life insurance ($DJUSIL, -0.94%). It was true again last week.
If we look at the top of the weekly leaderboard, however, that's where things turn much more bullish. Our key aggressive sectors - technology (XLK, +3.19%), consumer discretionary (XLY, +1.80%), and communication services (XLC, +1.85%) all beat the S&P 500. In other words, they led the market higher. Historically, this is one of the key signals of market rally sustainability. In fact, my favorite signal is the relationship between consumer stocks - discretionary vs. staples (XLY:XLP). The positive correlation between this ratio and the S&P 500 is undeniable:
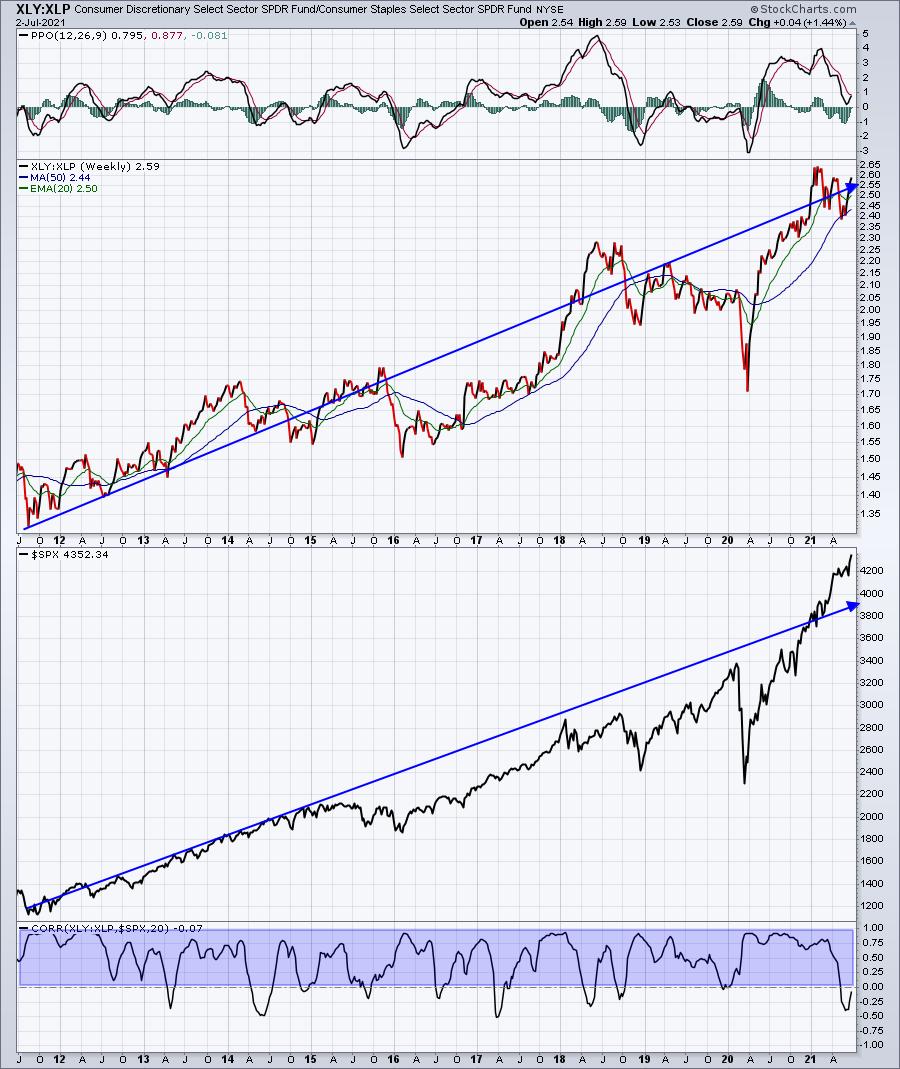
This ratio has pullbacks from time to time, just like uptrending stocks do. I don't worry about that. The key is that the uptrend remains in place - higher highs and higher lows. For comparison sake, I want you to see what this ratio looked like at the October 2007 high, just before we had one of the most significant price tops in history:
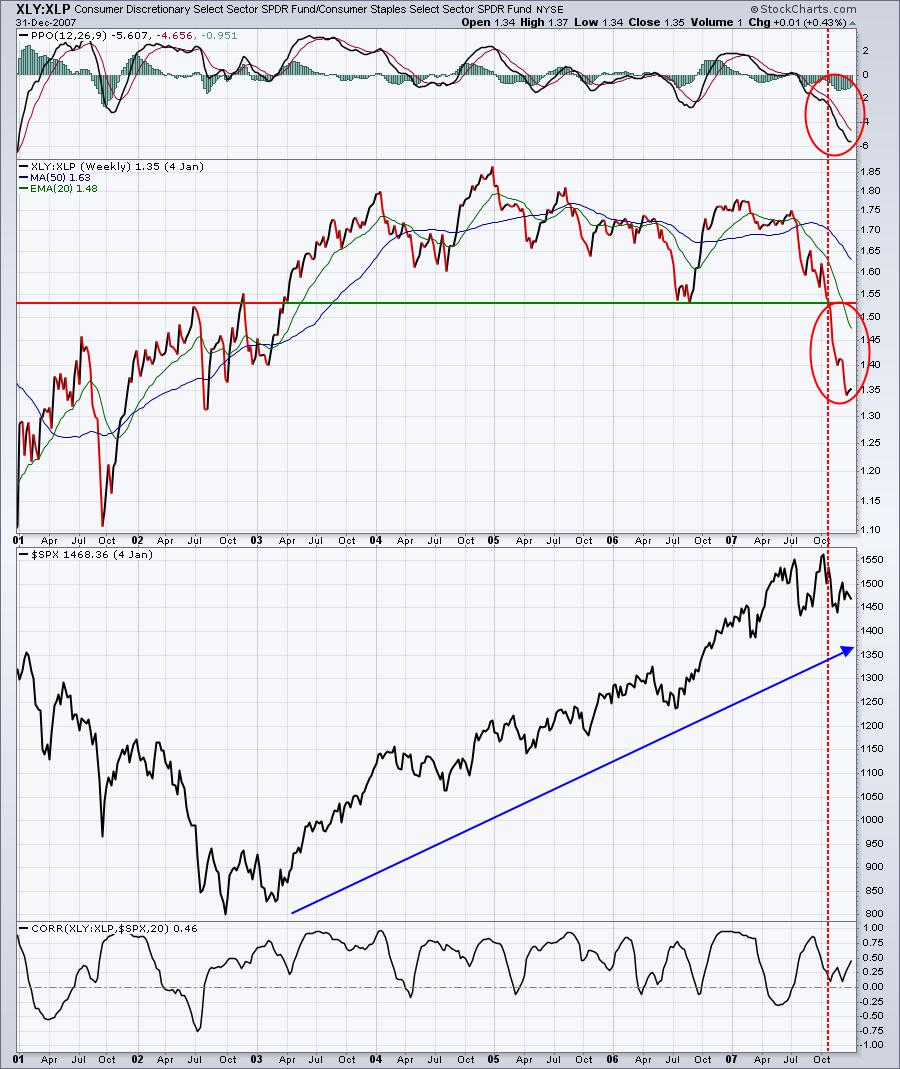
Can you see the difference? Wall Street was exiting discretionary stocks at an alarming pace. If you only looked at the S&P 500, everything looked fine - a slight end of year pullback in a clear uptrend. Beneath the surface, however, problems were deepening. That's why it's so extremely important to pay attention to these beneath-the-surface signals.
On Tuesday, July 6, at 4:30pm, I'll be hosting a free "2021 2nd Half Market Outlook" webinar, covering key intermarket relationships to help evaluate the sustainability of this market advance. I'll send out webinar room instructions on Tuesday to our entire EarningsBeats.com community, both paid members and free EB Digest subscribers. To save your spot in this timely webinar, simply CLICK HERE and provide your name and email address in the boxes provided to become a FREE EB Digest subscriber. There's no credit card required and you may unsubscribe at any time. Also, if you're unable to attend the event live, we'll make sure you get a recording to view at your leisure.
Learn the bear market signals to watch for. I hope to see you on Tuesday!
Happy trading!
Tom


