Following rotation in 2021 has been difficult because few industry groups have maintained leadership roles for any length of time. There have been a few. Specialty finance ($DJUSSP), internet ($DJUSNS), and software ($DJUSSW) come quickly to mind among our 5 aggressive sectors. Outside of the aggressive sectors, I could certainly point to coal ($DWCCOA), aluminum ($DJUSAL), and steel ($DJUSST). Beyond that, however, it's mostly been a very back-and-forth kinda year, where relative strength is just temporary. That's been problematic because just as you find quality leaders within various groups to trade, the industry strength vanishes and you're left holding the bag and trying to manage losses. Trust me, I know because I've been right there with you.
There are a couple industry groups, though, that have sustained relative uptrends after absolute breakouts that I haven't really discussed much, so let's take a look at one of those today.
Dow Jones U.S. Business Training & Employment Agencies Index ($DJUSBE)
When we think about all the job losses during the pandemic, it makes fundamental sense that a recovery in jobs would benefit this group. And it has. First, let's consider the relative strength on a longer-term 5-year weekly chart:
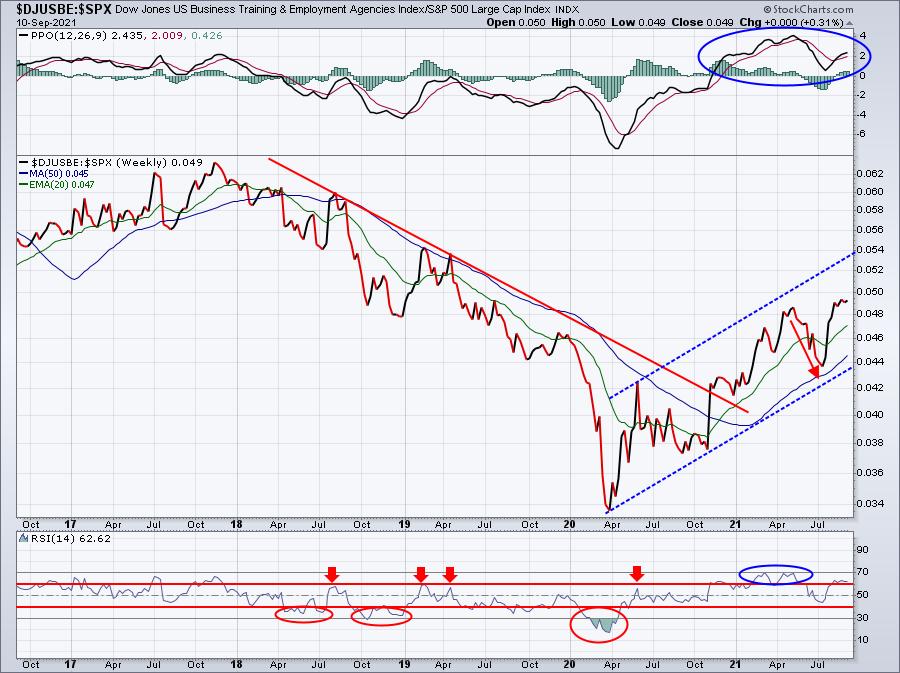
The trending relative price action should be rather easy to see. The DJUSBE was downtrending relative to the benchmark S&P 500 for two years PRIOR to the pandemic low. Look at the RSI throughout that period - never above 60 and frequently at 30 or below. That's confirmation of the downtrend. Since the late-March 2020 relative low, however, the look of the RSI (and the trend, of course) has changed. Now the RSI is holding support at or near 40, while we're seeing the RSI touch or break above 70. That's a clear confirmation of an uptrend, or, in this case, a relative uptrend.
Relative price charts help us determine whether there's strength relative to a benchmark as there's a much greater chance of trading success if you're invested in an area that's outperforming. That's why having the knowledge that the DJUSBE is outperforming gives us an advantage. Of course, nothing lasts forever so we have to be objective and continue to follow the relative price chart for further information as time moves on.
So now that we know the DJUSBE is a solid industry group worth researching for leading stocks, let's check out the absolute price chart of the DJUSBE to see at what price levels we should consider entry:
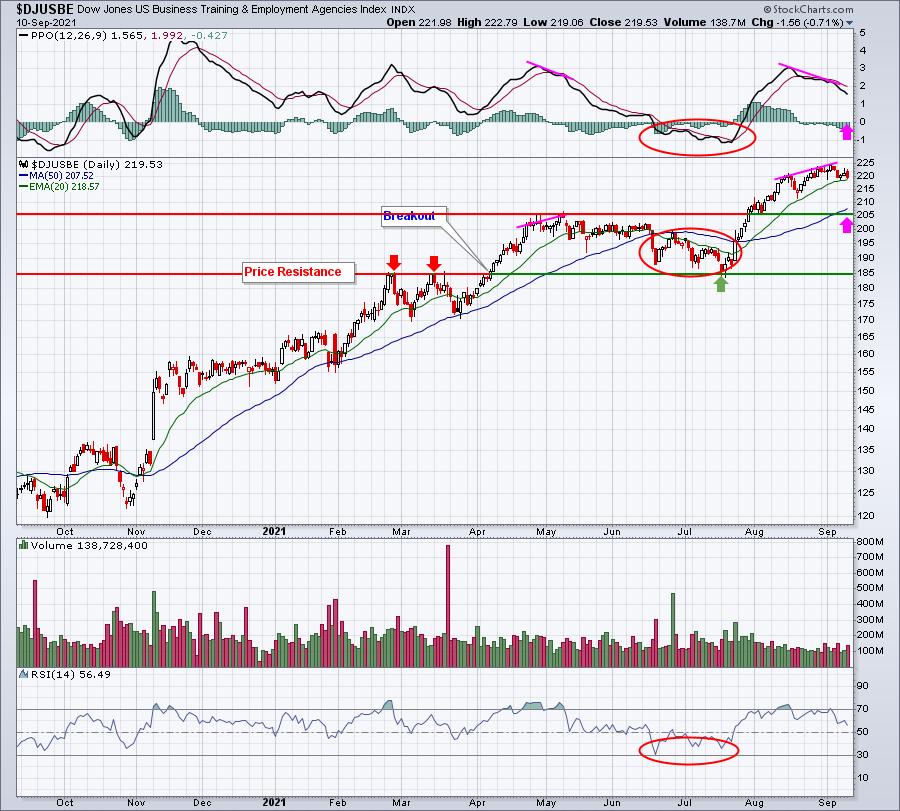
This is an absolute PERFECT illustration of why price support/resistance is my PRIMARY indicator and divergences, RSI and others are SECONDARY indicators. The June-July period saw the PPO turn negative, the RSI drop to 30, and price trend well below the 50-day SMA, not to mention the death cross of the 20-day EMA beneath the 50-day SMA. So what's to like? PRICE SUPPORT. The double top in February and March was price resistance until the breakout in April. Then that previous price resistance becomes price support. It wasn't until three months later that price support was tested. That was a GREAT ENTRY into the industry group because all technical indicators were negative. If price support didn't hold, then you've got problems, Houston. Instead, price support held beautifully and the rest is history. Be very, very careful following technical indicators other than price support/resistance, and using them as PRIMARY indicators. Personally, I believe that's a BIG mistake.
Currently, the DJUSBE has a negative divergence similar to early May that led to all that selling. Throw in the September seasonality and I'd be patient here, looking for much better entry opportunity in the coming weeks. If you're not aware of historical tendencies, I'd strongly encourage you to check out my ChartWatchers article this weekend, "What You Need To Know About September Weakness."
I'm also planning to provide a historical piece of data that most investors/traders are likely unaware of, but I believe it's knowledge that everyone should have, particularly if you trade in the short-term. This historical data will be included in our Monday edition of EB Digest, our FREE newsletter that's both informative and educational. There is no credit card required and you can unsubscribe at any time. If you'd like to receive Monday's newsletter and you're not already a EB Digest free subscriber, simply CLICK HERE and enter your name and email address. We'll take care of the rest!
Happy trading!
Tom


