Before I begin this article, let me be clear that I remain extremely bullish for the long-term. We're nowhere close to where we're going, which is much, much higher. But in the very near-term, I'm growing increasingly bearish. There are a few reasons, which are all short-term in nature, so let's get to them.
Max Pain - Options Expiration
This is a normal monthly routine, one in which we explore in great detail at EarningsBeats.com every month. The Tuesday before the 3rd Friday (today) is a regular members webinar where we look to the options market as a short-term guide for equity market direction. The massive number of monthly calls and puts tend to see big imbalances, especially if the S&P 500 has been trending. If you haven't been watching, the S&P 500 was just below 4300 to open October. Last week, we pierced the 4700 level. I'll be calculating the max pain level - the point at which in-the-money call value is completely offset by in-the-money put value - later today. It's almost guaranteed to be at least 4-5% lower than where we currently stand. As an example, here's a screen shot from CBOE.com, reflecting the number of open calls and puts close to the current strike price:
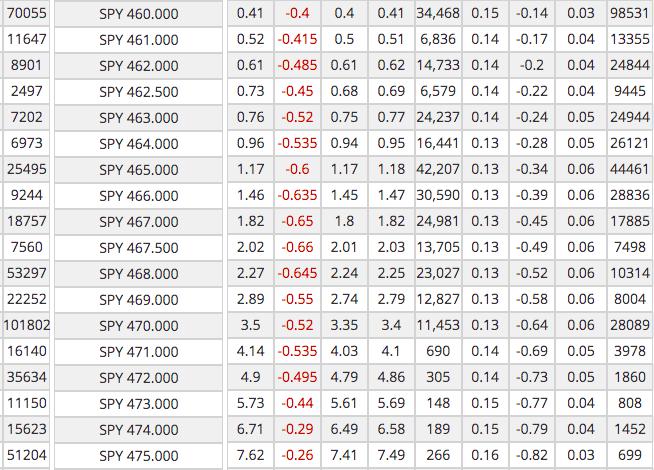
The far left column is the "open call interest", while the far right column represents the "open put interest", for all SPY strike prices shown. Keep in mind that there are literally hundreds of thousands of open call interest below the 460 strike price level first reflected in this screen shot. Without even calculating the amount of net in-the-money call premium, I can confidently say it's likely somewhere in the $1 to $2 billion range. If the SPY continues moving higher, this number only grows even further. A pullback into Friday or early next week would save market makers hundreds of millions of dollars in option premium. You think this doesn't matter? You'd better think again.
In August 2021, the SPY was trading at 443.09 when we held our max pain webinar. I had calculated "max pain" to be 431.31, which suggested a potential decline of 2.66%. Just two days, the SPY gapped down and hit a low of 434.73. It never moved down to 431.31, but, as I explain to our members at EarningsBeats.com, I use options expiration week and max pain as a directional clue. It's simply another indicator to me that I absolutely want to review heading into options expiration Friday. Trust me, market makers made a small fortune on that pullback.
In September 2021, the SPY was trading at 444.28 when we held our max pain webinar. I had calculated "max pain" to be 428.17, which suggested a potential decline of 3.63%. Four days later, the SPY hit a low of 428.86. The market makers lined their pockets once again at the expense of options traders.
Strike One.
Now here we are in November, likely ready to repeat history. At 4:30pm this afternoon, I'll be hosting our "November Max Pain" webinar, designed to calculate the risk in the market and also to identify individual stocks that could benefit from this short-term market inefficiency. If you'd like to attend this webinar today, and are not already an EarningsBeats.com member, you're in luck. In addition to a 30-day FREE trial, which you can sign up for HERE, we're also running our Fall Special, the best deal we've ever offered. CLICK HERE to check out the terms of our Fall Special. You get the best of both worlds -(1) a free trial to experience our service, including tonight's Max Pain webinar, and (2) if you like our service, the opportunity to sign up to our best annual deal ever!
Negative Divergence
We don't currently show a negative divergence, but part of trading is anticipating what could happen. Another short-term move higher in the S&P 500 will almost certainly result in a negative divergence as the PPO has already rolled over, indicative of slowing upside momentum. Check this out:
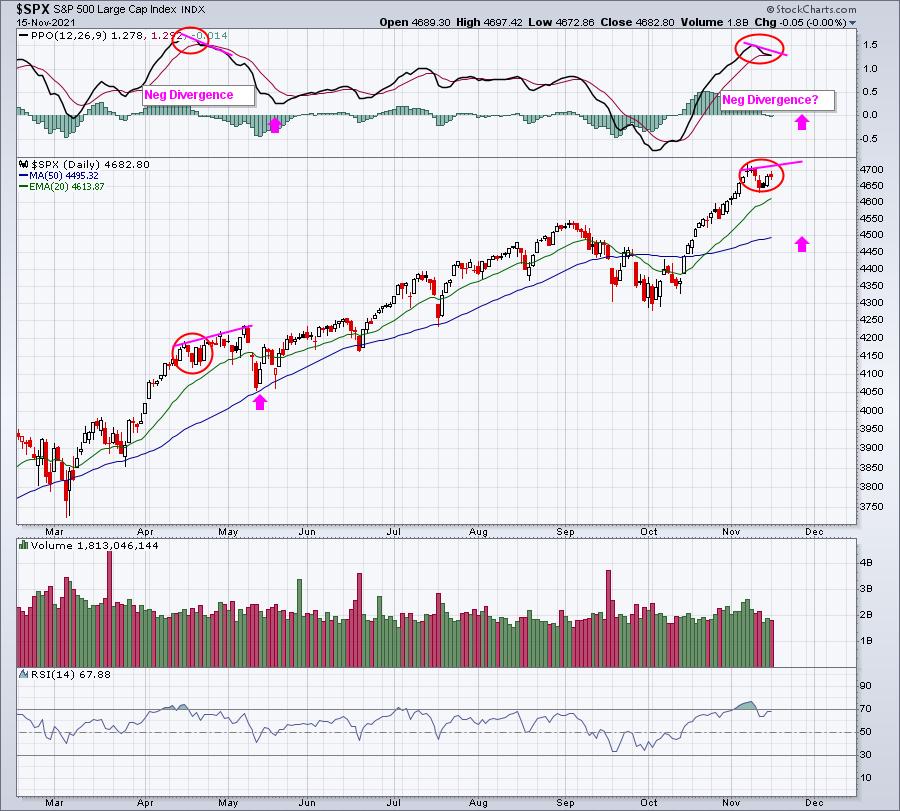
Negative divergences never guarantee us any future selling. I've seen ugly divergences completely ignored and the market moving straight up. It's not that technical analysis didn't work, because I don't look for technical analysis to provide me absolute certainties. Instead, I use technical analysis to help me manage risk. Negative divergences simply suggest that bullish price momentum is slowing, which, in turn, can lead to short-term weakness.
Strike Two.
MAJOR Sentiment Issue
Strike three is the biggest strike in the count and right now the Volatility Index ($VIX) is serving up a 105 mph fastball. Perhaps the bulls can hit it, but my guess is that it'll be a big whiff! The typical relationship between the VIX and the S&P 500 is one of an inverse nature. When the S&P 500 struggles, the VIX rises. And when the S&P 500 moves up, the VIX almost always declines. Therefore, over time, we should see an inverse relationship between the two when we examine the correlation coefficient. Here's the proof:
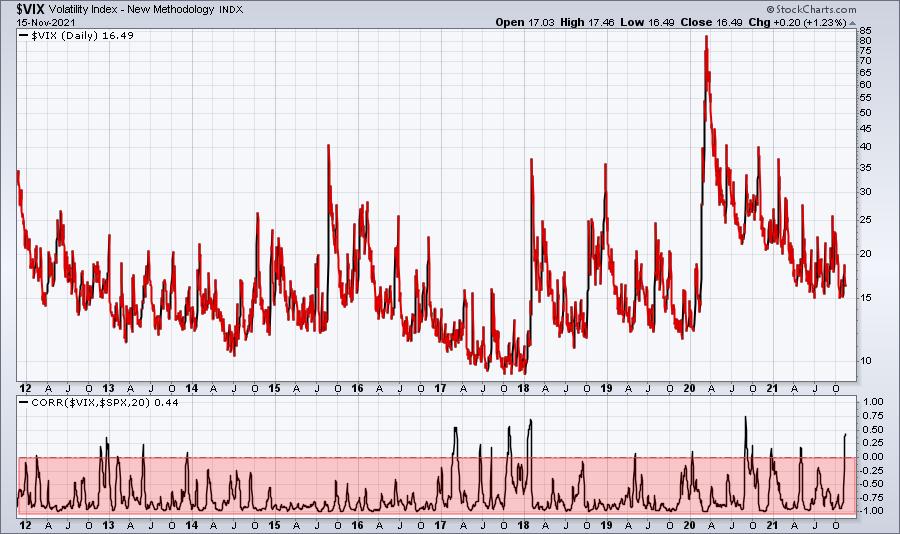
The red-shaded area confirms exactly that. This correlation coefficient nearly LIVES down near -1. This isn't just inverse correlation. It's near-perfect inverse correlation. But those spikes are very interesting. Let me shorten this chart to 3 years and add the S&P 500 performance to the chart so that you can see what happens when the correlation turns positive:
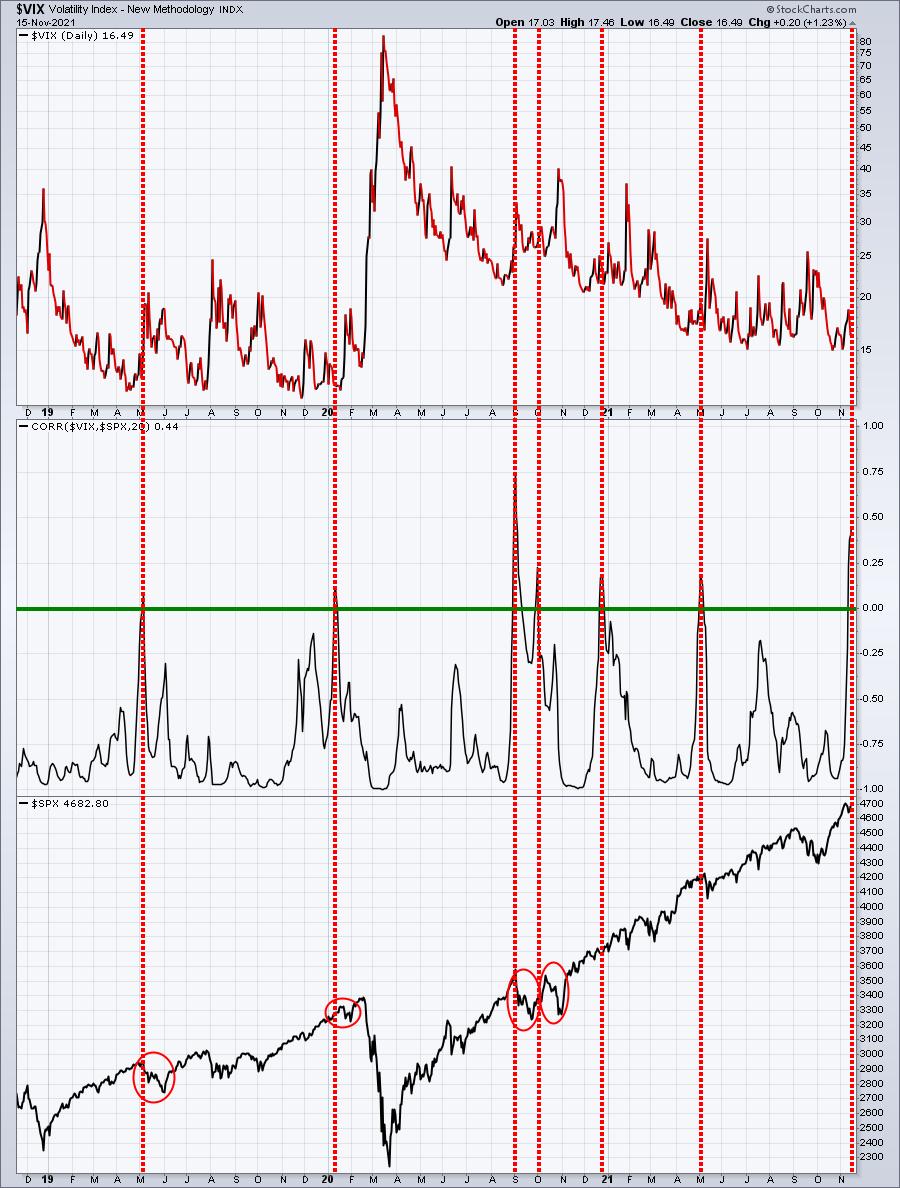
While we don't always see immediate selling, I believe there's enough evidence here to suggest that rises in correlation above 0 between the VIX and $SPX are worth mentioning. Think about what this chart is telling us. The S&P 500 continues rising, while fear escalates. In other words, the market is mood is beginning to grow very nervous. Any selling can trigger a much bigger reaction because market participants are already anticipating a potential decline.
14 months ago, when this "positive" correlation hit its 3-year high, I wrote an article "2 Sentiment Indicators Are Suggesting Extreme Caution - BEWARE!". That was before the market decline started. It's important to keep one eye on sentiment at all times.
Bulls, STRIKE THREE!
Again, I'm not at all concerned about the longer-term picture. But I take note of these short-term issues and adjust my trading strategy accordingly. Please consider joining me for tonight's "November Max Pain" event. Get your FREE 30-day trial started!
Be careful right now.
Happy trading!
Tom


