For me, the breakout in a particular area triggers a series of questions in order to find the best trading opportunities. Last week, small caps finally joined the U.S. equities party in all-time high territory. The chart breakout is simply the first step in my research:
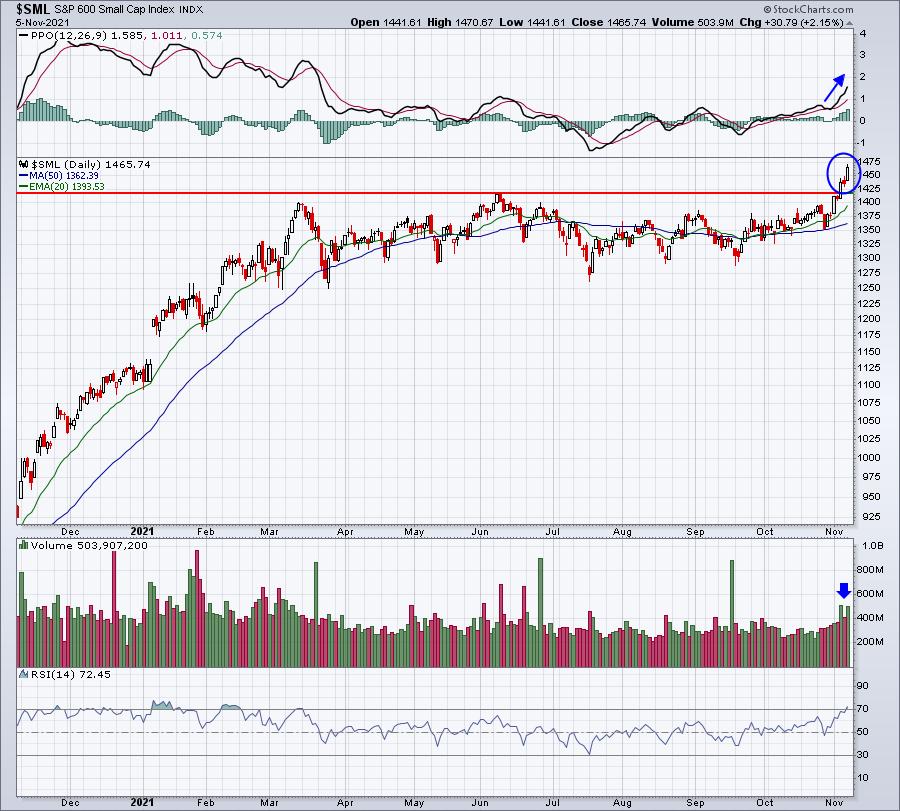
This provides us a blue print of an area that we now need to consider for trading - the small caps ($SML). But that's a very general consideration. Which small caps? Well, for those who prefer trading ETFs, it's a bit simpler, but there are still plenty of options. The iShares Russell 2000 ETF (IWM) is a great place to start, as is the SPDR S&P 600 Small Cap ETF (SLY). These are both widely-diversified small cap ETFs and their charts are very similar, but based upon the bottom relative panel, I'd likely choose SLY:

Relative strength suggests, for now, we favor SLY vs. IWM, but I'd expect both to do well, given last week's breakout in the overall asset class.
Ok, so you want to further break this down? Well, I'd look at the various small cap sector ETFs on an RRG chart and compare them to their small cap benchmark ($SML). Here's what that looks like on a daily RRG right now:

The PSCE (energy) had been the best performing, but that long tail as it speeds toward lagging is a big concern. We need to see that group turn higher quickly in order for it to re-establish its small cap leadership position. To a lesser extent, the PSCF (financials) look similar. The two groups that look best to me right now, at least from an RRG perspective, are technology (PSCT) and industrials (PSCI).
Another way to view relative strength and relative momentum is to compare the small cap ETFs vs. their large cap ETF counterparts, so the PSCT vs. XLK, PSCD vs. XLY, PSCI vs. XLI, etc. I looked back at the SML and saw that it bottomed on October 27th at 1353.21. From that low through Friday's close, the SML jumped 112.53 points, or 8.32%. But what sectors were the true catalysts of this breakout? As money rotated heavily into the small cap space, what areas were being bought? That's what I want to know. Well, with a little Excel spreadsheet magic, here it is:
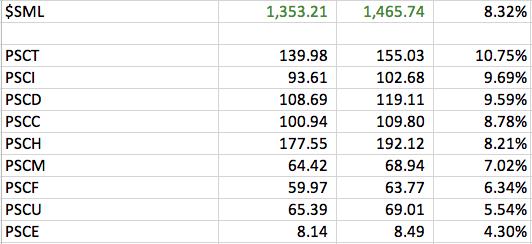
Those top two, PSCT and PSCI, represent technology and industrials, respectively. The third group (PSCD) represents consumer discretionary. These are three aggressive sectors. So investors are pouring into perhaps the most aggressive stocks on the planet - small cap stocks in aggressive sectors. How can we possibly be bearish the stock market? I keep screaming not to bet against this secular bull market, and yet, when I see media headlines, that's exactly what I see. Folks are still trying to call market tops. It's such a disservice to their audience. I'll keep following the charts and let others stick with their permanently-bearish views.
I digress.
All of my "below the surface" signals point to a continuing secular bull market. My biggest worries were transportation stocks ($TRAN) and small cap stocks ($SML) and now they've broken out. Honestly, there's little to support a bearish view. You have to go out of your way to find anything resembling bearish behavior.
On Monday, November 8th, I'll be unveiling a small cap stock that recently BLEW AWAY earnings estimates and is poised to ride this small cap wave higher. If you're not already a FREE EB Digest subscriber, you can CLICK HERE and enter your name and email address to join. That's all it takes. There's no credit card required and you may unsubscribe at any time. I publish this newsletter 3x per on Mondays, Wednesdays, and Fridays. It's an opportunity for us at EarningsBeats.com to give back to the community that supports us. Our community of knowledgeable traders is now in the tens of thousands. Please consider joining us.
Do me one other favor, if you don't mind. If you enjoy my articles, please scroll down and "subscribe" to my blog. You can enter your email address and hit the green "Subscribe" button. All of my articles will then be sent to your email as soon as I publish my articles. Thanks!
Happy trading!
Tom


