 |
Delivering The Web's Best Financial Commentary Straight To Your Inbox
|
| March 18, 2017 |
Hello Fellow ChartWatchers!
Welcome to the latest edition of ChartWatchers, the newsletter for technical analysts, online investors, StockCharts users and more. In addition to this week's articles, don't forget to check out the Site News section (below) for some important announcements and updates about what's going on around StockCharts this month!
Enjoy!
- Grayson Roze
Having trouble viewing this email? Click Here to view online
|
|
|
|
Check out the new User-Defined Index Workbench!
If you haven't already seen it, we just launched our new-and-improved User-Defined Index Workbench! As a StockCharts member at our Extra or PRO service levels, you have the ability to create your own our User-Defined Indexes (UDI, for short). You can store any kind of daily time-series data in a custom UDI and then chart that data on the SharpCharts workbench, just like any other widely-available index. For example, you can create a UDI to chart price data for a mutual fund that we don't cover, or another that tracks your portfolio value over time. (For more information about our UDI feature, click here). If you've never taken advantage of this unique tool, now is the perfect time! The new UDI workbench is easier to use, more powerful than ever and has been optimized to work on every screen size, whether you're on a laptop, tablet or smartphone! Click here to visit the new UDI workbench now!
Did you catch Arthur Hill's Market Outlook webinar?
If you didn't get a chance to watch Arthur Hill's exclusive market outlook webinar last Saturday, don't worry! You can still catch the recorded version in our Webinar Archives. Arthur joined fellow expert technicians Tom Bowley and Greg Schnell on a special webinar to share his detailed analysis of the current market climate and present his outlook for where the markets are heading. Be sure to watch the recording!
|
|
|
|
|
|
|
by John Murphy
|
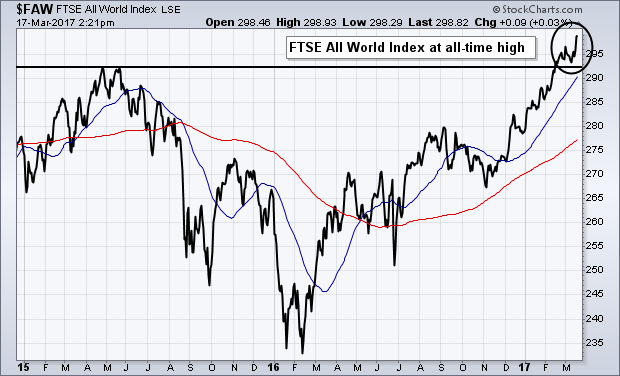 |
Chart 1 shows the FTSE All-World Stock Index ($FAW) trading at a new record high. The FAW includes stocks from 47 developed and emerging markets. It just recently cleared its 2015 high which resumed its major uptrend. That's a positive sign because it shows that the stock market rally is global in scope. The FAW, however, is heavily influenced by the U.S. market which is also |
|
|
|
|
|
|
by Arthur Hill
|
 |
Two Indicators in One Indicators generate lots of signals and many of these signals are just noise. It is imperative that chartists understand how their indicators work and exactly what these indicators are saying. Understanding the ins and outs of an indicator will help chartists determine which signals to take seriously and which signals to ignore. |
|
|
|
|
|
|
by Greg Schnell
|
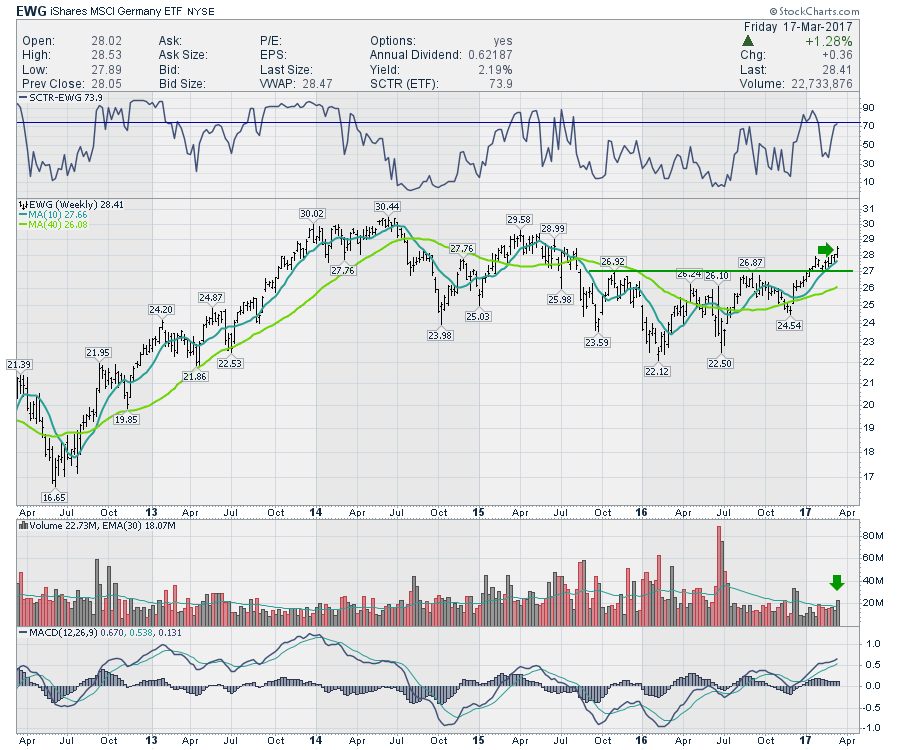 |
In my Chartwatchers article for March 4th, I was focused on some Country Indexes like Germany's $DAX and India's $BSE. The commentary revolved around watching these markets for potential breakouts. You can follow this link to check it out. 5 Foreign Markets Are At Must Watch... |
|
|
|
 |
|
|
|
by Tom Bowley
|
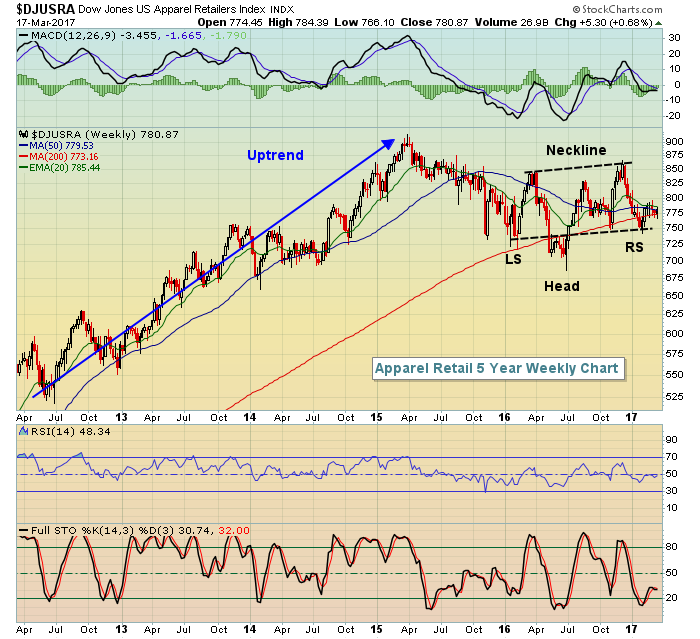 |
Over the past year, the Dow Jones U.S. Apparel Retailers Index ($DJUSRA) has been one of only four industry groups in the consumer discretionary space that has posted a loss. And over the past three months the DJUSRA is the worst performing area of consumer discretionary. But keep in mind that March is the best calendar month of the year for apparel retail stocks historically |
|
|
|
|
|
|
by John Hopkins
|
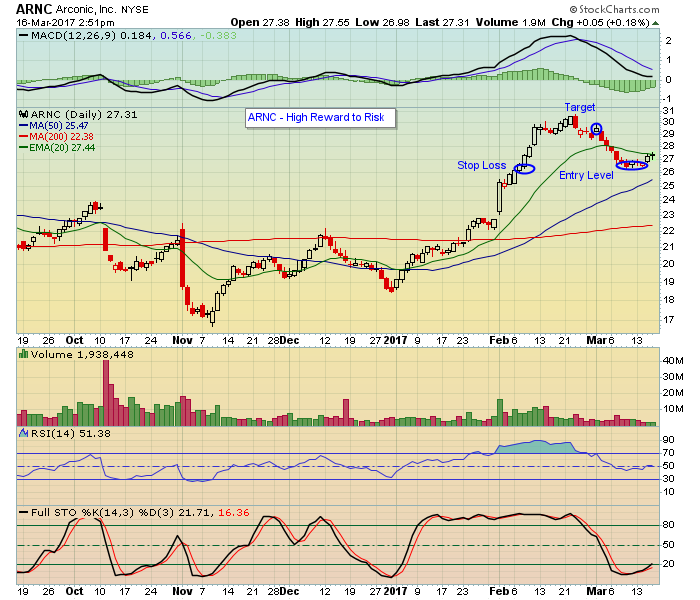 |
As part of our service at EarningsBeats.com we send trade alerts to our members on stocks that beat earnings expectations. But before we notify members of any trade candidates we look closely at the "Reward to Risk' ratio as we want to make sure it is favorable before we pull the trigger. The basic concept is this. We only want to get involved in trades that have much more upside than downside... |
|
|
|
|
|
|
by Erin Heim
|
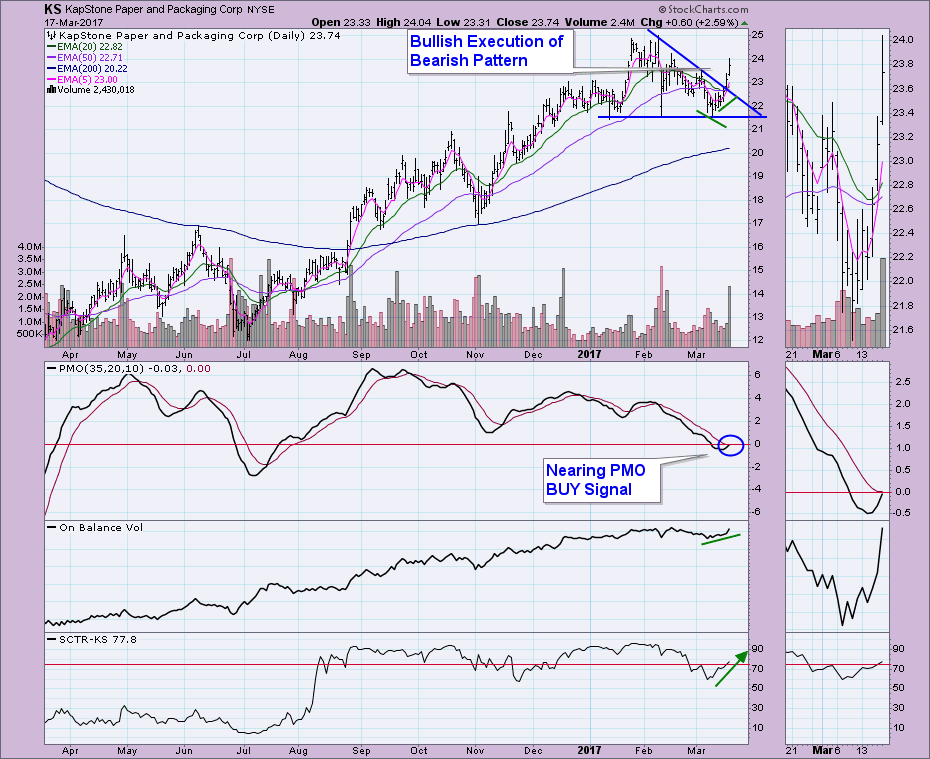 |
I am asked constantly about how to use the Price Momentum Oscillator (PMO) and Trend Models in a scan. These two ingredients combine into a great... |
|
|
|
|
|
|
by Gatis Roze
|
 |
Here is how to tell if it's a regular market pullback versus a serious bearish correction. I strongly disagree with those that claim market timing is toxic. Review this sample of eight of my charts. These types of tools have helped me side-step all the major corrections over the past 25 years. Focus on reviewing these charts at the major turns. You'll see that you, too... |
|
|
|
|
|
|
|
|
|
Unlock All of Our
Tools and Features
- + Larger, Full-Screen Chart Sizes
- + Intraday Charts with Real-Time Data
- + Exclusive Members-Only Commentary
- + Custom Technical Scans and Alerts
|
|
|
|
|
 |
|
|
|
ChartWatchers is our free, twice-monthly newsletter for online investors and StockCharts users. Whether you are brand new to charting or a seasoned analyst, each edition of ChartWatchers brings you insightful, expert commentary from the industry's leading technicians. See what's really happening in the markets through their eyes and gain an edge in your own investing.
|
|
|
|
|
|
| For more information about the ChartWatchers Newsletter or to subscribe for free, Click Here |
This email was sent to [email]. Need the newsletter sent to a different email address?
Simply unsubscribe your current email, then re-subscribe using the new address. |
| Click Here to instantly unsubscribe |


