Another insightful issue of the ChartWachers Newsletter has arrived!

Expert Technical Commentary Delivered Straight To Your Inbox

June 17, 2017

Hello Fellow ChartWatchers!

Welcome to the latest edition of ChartWatchers, the newsletter for technical analysts, online investors, StockCharts users and more. In addition to this week's articles, be sure to read Chip's article (below or online) to learn more about our latest addition to the new Members Dashboard!

Enjoy!

- Grayson Roze

Having trouble viewing this email? Click Here to view online

This Week's Articles

Chip Anderson

Latest Members Dashboard Update - #AWESOME!

Hello again, everyone! Just a quick note to tell you about an awesome new feature that we just rolled out. We've updated the Members' Dashboard so that it is now even more customizable and useful. The change is subtle - you would probably miss it if you weren't reading this article - but it is very powerful.

There is now a new little "Gears" button in the top right corner of the Members' Dashboard. If you don't see it, click on "Members" and then look above the top right corner of the "Market Movers" panel next to the "ChartLists" button. See it? Good. Now click it.

You will be presented with a dialog that contains two checkboxes - one for "Scan Center/Alert Center" (which should be checked) and one for "Additional Data Panels" (unchecked).

Check the "Additional Data Panels" checkbox (check-circle?) and press "Update." VOILA!

There are now three more "Market Movers" panels just like the one on the right side of the page. The new panels are in a row right below the first row of panels. Initially, they all display the same thing - which is definitely boring. BUT, you can now change each of them to be whatever you want. Just click on the dropdown labeled "Top 10" in each panel and select something different. Whatever settings you select will "stick" and be back the next time you visit the page.

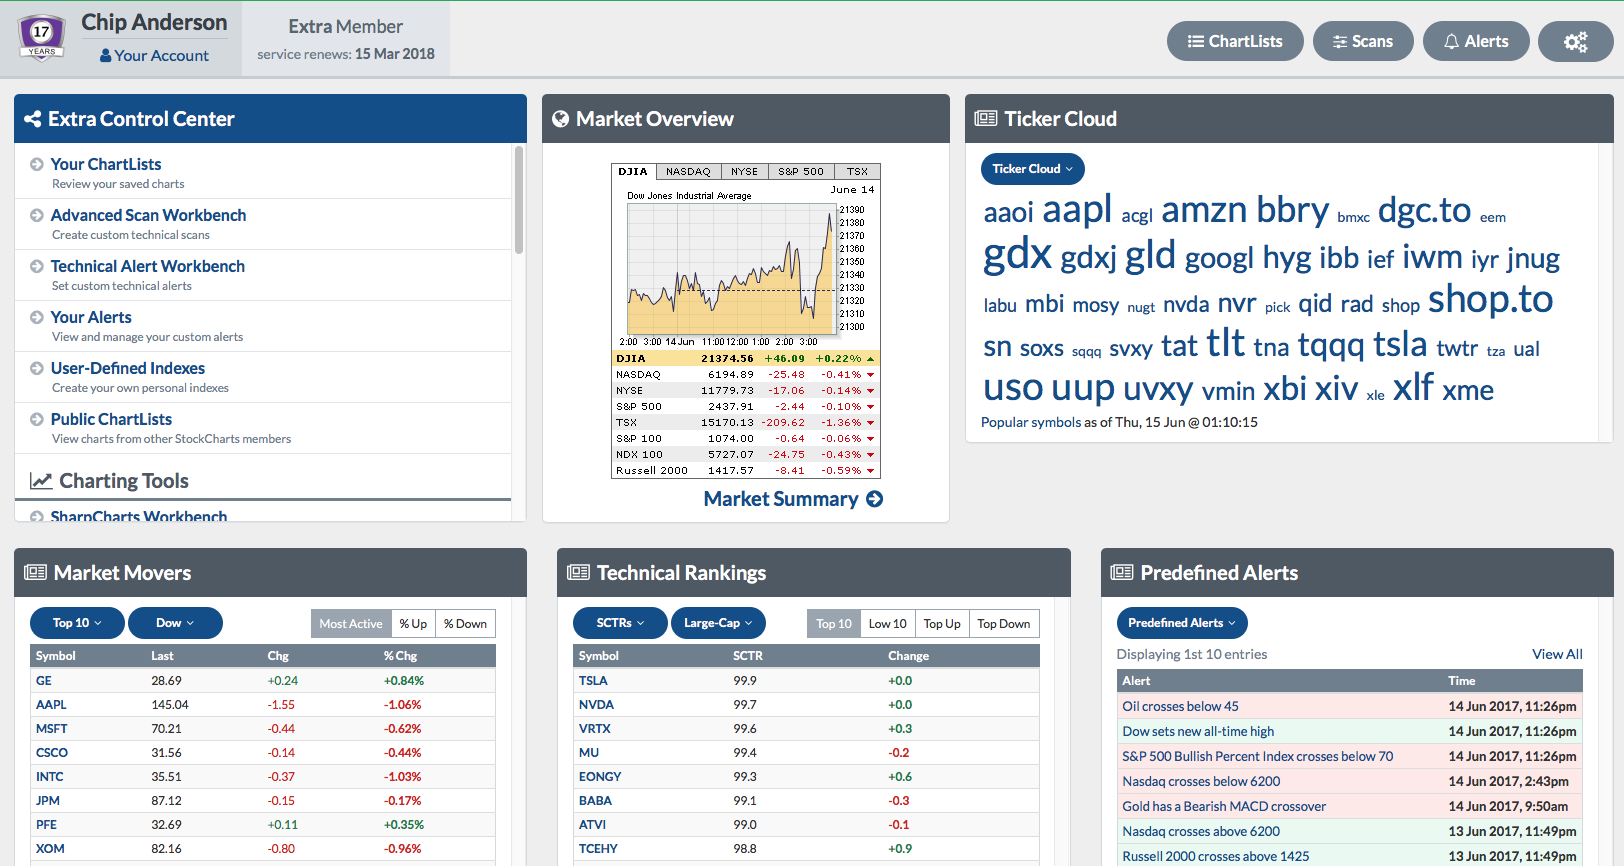
Personally, I've put the Ticker Cloud in the upper right panel, the S&P 500 Top 10 in the next panel, the Large-Cap SCTRs in the middle panel, and the Predefined Alerts in the lower-right panel. Here's what it looks like after changing those settings:
VERY COOL!!!

Note: Right now the settings are stored in your browser's cookies which means that if you change browsers or computer (or you clear your cookies) you'll need to re-set things up.

Just one more way we are continuing to improve the website. Enjoy!
- Chip

The Market Message

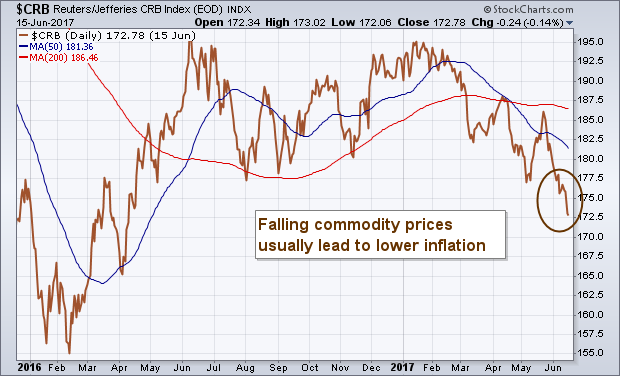
Falling Commodity Prices Are a Big Reason Why Inflation Is So Low

Article Image Ever since Wednesday's Fed rate hike, and the press conference by Janet Yellen, I've been thinking a lot about inflation. I believe the Fed is underestimating how weak inflation really is. I also believe that's because it's looking in the wrong places. Or, more to the point, it's ignoring the weak signals hiding in plain sight. Namely, falling commodity prices. Chart 1 shows the...
Read Article

Art's Charts

Charles Dow and Leonardo Fibonacci Walk into a Bar

Article Image The bar was 61.8 inches off the floor, but Leondardo still did not see it. All (bad) joking aside, I would like to look at corrections through the eyes of Charles Dow and Leonardo Fibonacci. These two may seem miles apart at first glance, but the numbers suggest otherwise. In fact, Dow and Fibonacci are pretty much on the same page when it comes to retracement amounts. Charles orders a...
Read Article

Bookstore Special

The Canadian Technician

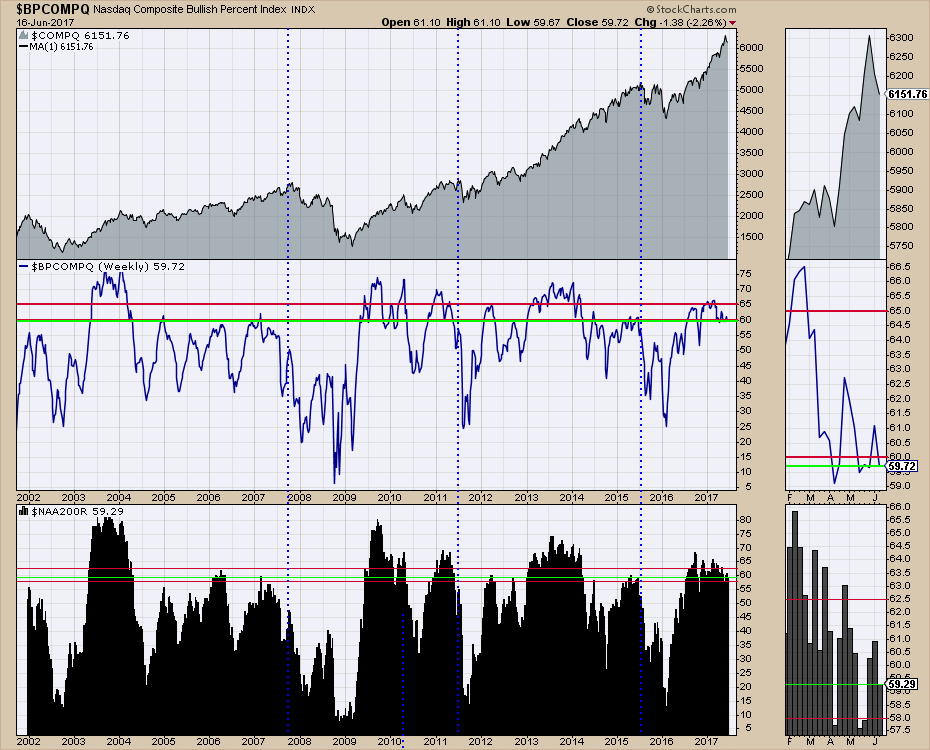
Why Breadth Matters Today

Article Image The US markets and Canadian markets are totally different beasts right now, but it makes a great learning moment to look at both of them to understand how markets break down. The chart below is the Bullish Percent Index for the Nasdaq Composite ($BPCOMPQ). I have two other plots on the chart. On top is the plot of the Nasdaq Composite ($COMPQ) and the...
Read Article

Trading Places

Summer Generally Means Trading Quality, Not Quantity

Article Image History tells us many things. One of the lessons is that making money on the long side is much more difficult during the summer months. Why? It's rather simple. On the S&P 500 since 1950, here are the annualized returns by calendar months over the summer: June: -0.02% July: +12.21% August: -1.07% September: -6.01% Including the current...
Read Article

InvestEd Central

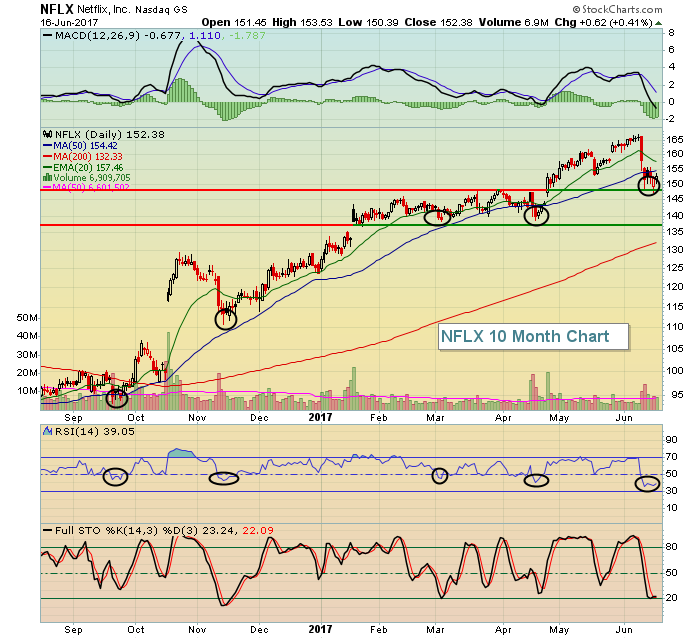
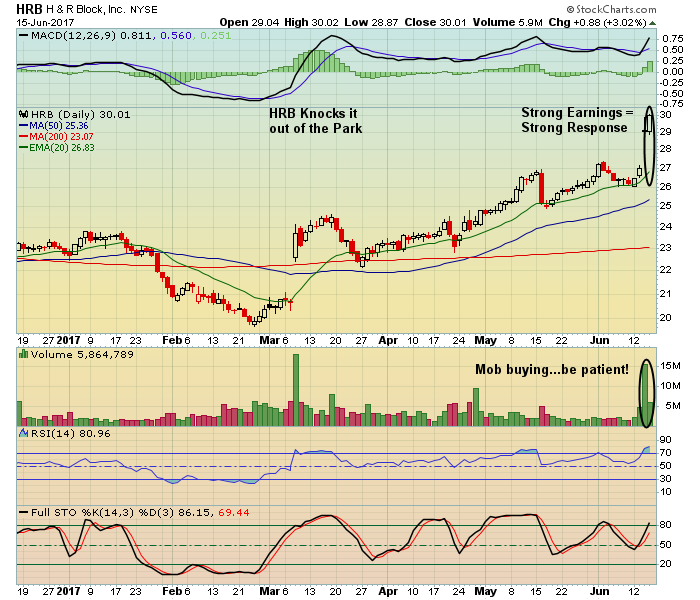
Managing Risk - Identifying Strong Reward to Risk Trading Candidates

Article Image If you are looking for ways to manage risk in an increasingly volatile environment then you should start by searching for the "best of the best"; those companies that beat earnings expectations and have solid charts. This makes an awful lot of sense if you think about it; riding the coattails of those stocks that are both fundamentally and technically sound. For example, take a look at the
Read Article

DecisionPoint

S&P 100 Flips Back to IT PMO SELL Signal - DP Scoreboard Weekly Charts

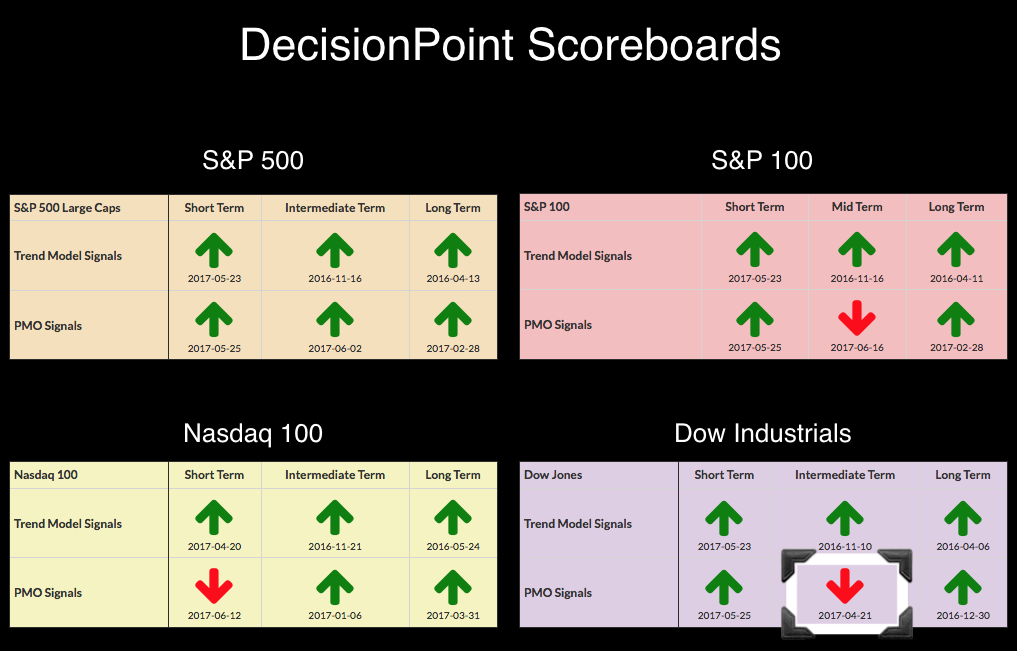
Article Image On the last trading day of the week, the DecisionPoint IT Price Momentum Oscillator (PMO) signals go "final". Today saw a new weekly PMO SELL signal on the OEX. Some may recall that just last Friday the OEX triggered a weekly PMO BUY signal. Don't let the very "green" Scoreboards fool you, there is deterioration in momentum on nearly all daily and weekly charts for these four indexes. To see
Read Article

The Traders Journal

The Albert Einstein Approach to Stock Market Investing

Article Image Albert Einstein famously said, "If I had one hour to save the world, I would spend 55 minutes defining the problem and five minutes implementing the solution." If you were in a life threatening situation and had only one hour before it proved fatal, what would you do? Einstein said he'd spend his time wisely asking probing questions to understand the problem in depth. Having...
Read Article

See More Articles …

Become a Member

Become a Member

Unlock All of Our
Tools and Features

  • + Larger, Full-Screen Chart Sizes
  • + Intraday Charts with Real-Time Data
  • + Exclusive, Members-Only Commentary
  • + Custom Technical Scans and Alerts
Free 1-Month Trial
Visit ChartSchool

About ChartWatchers

ChartWatchers is our free, twice-monthly newsletter for online investors and StockCharts users. Whether you are brand new to charting or a seasoned analyst, each edition of ChartWatchers brings you insightful, expert commentary from the industry's leading technicians. See what's really happening in the markets through their eyes and gain an edge in your own investing.

f t
For more information about the ChartWatchers Newsletter or to subscribe for free, Click Here
This email was sent to [email]. Need the newsletter sent to a different email address?
Simply unsubscribe your current email, then re-subscribe using the new address.
Click Here to instantly unsubscribe