 |
|
Expert Technical Commentary Delivered Straight To Your Inbox
|
| September 2, 2017 |
Hello Fellow ChartWatchers!
Welcome to the latest edition of ChartWatchers, the newsletter for technical analysts, online investors, StockCharts users and more. In addition to this week's articles, don't forget to check out the Site News section (below) for some important announcements and updates about what's going on around StockCharts this month!
Until next time,
- Grayson Roze
p.s. The StockCharts Team would like to take this opportunity to honor Dr. Henry "Hank" Pruden, a true pioneer in the technical analysis community who unfortunately passed away just last week. Hank, your influence will not soon be forgotten.
|
|
|
|
Announcing The New Advanced Scan Workbench!
In the last ChartWatchers Newsletter, we announced the release of our newly updated Technical Alert Workbench. Well, in this week's edition, we're pleased to say that the good news just keeps on coming! Last week, we rolled out our new-and-improved Advanced Scan Workbench. Like the other site improvements we've launched this year, the new Scans Workbench is faster, more user friendly and fully scalable across all device sizes. Whether you're on your laptop at home or your smartphone on the go, creating customs scans in your StockCharts account has never been easier.
If you're unfamiliar with our custom scans feature, this is one of the most powerful aspects of StockCharts Membership. As a member, you can use the Advanced Scan Workbench to create and run your own custom technical scans on the more than 50,000 symbols in our database. By allowing you to build scans with your own unique criteria, our advanced scan engine makes it quick and easy to pinpoint stocks, ETFs or other securities that fit exactly what you're looking for. No more digging through hundreds of charts, wasting your precious time trying to find the right stock!
Remember, the Advanced Scan Workbench can be accessed in one click from the Control Center of your Members Dashboard (or, click here!).
If you're not a StockCharts Member, this is yet another core feature that you can't afford to miss! Start your FREE 1-month trial today, and unlock all of our most powerful tools and resources!
|
|
|
|
|
|
|
by John Murphy
|
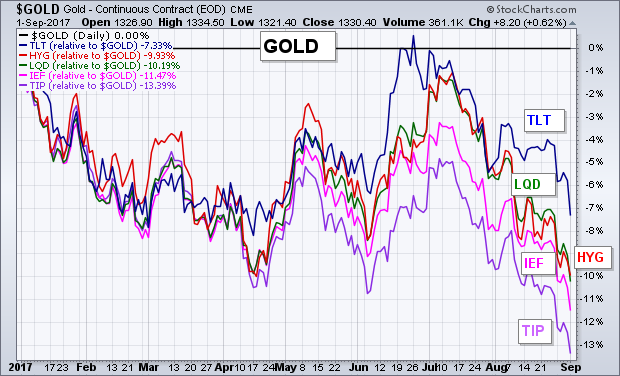 |
During the week, I wrote about gold (and gold miners) achieving upside breakouts and outperforming stocks for the first time since 2011. Gold, however, is also doing better than bonds for the first time in six years. Not just some bond categories, but all of them. The chart below plots five bond ETFs relative to the price of gold (flat black line) since the start of the year. And all five... |
|
|
|
|
|
|
by Greg Schnell
|
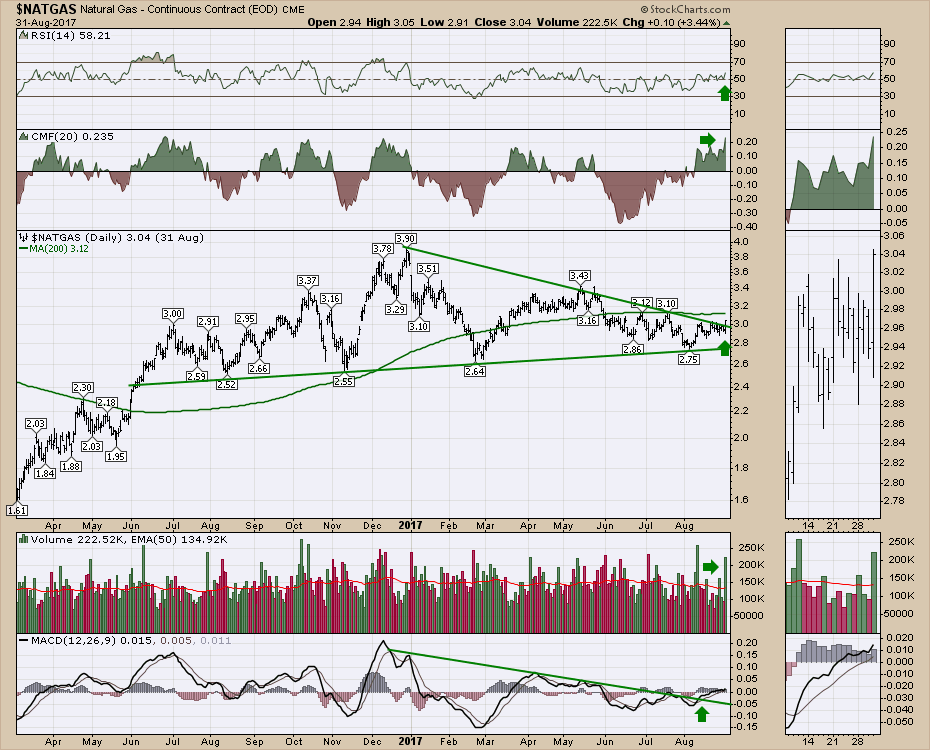 |
I get it. Energy has been the worst sector for the last 8 months. Everything is ugly. So is there absolutely no hope? There are some wonderful clues on the charts that this might start to heat up. Not just on Hurricane Harvey, but the charts were starting to get interesting in July. Now on September 1, they are very interesting! Natural Gas ($NATGAS) looks really good |
|
|
|
|
|
|
by Tom Bowley
|
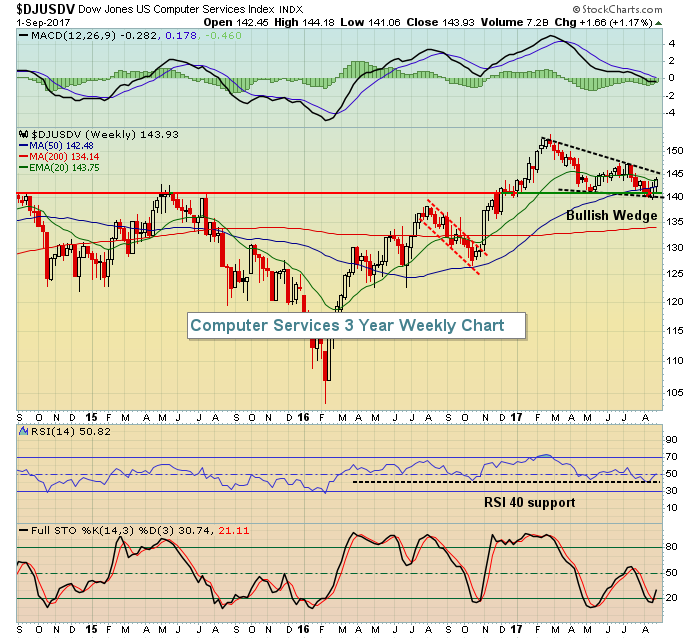 |
One of my trading strategies is to trade the best stocks in the best industries at the best price. Sounds easy enough, right? But what does this mean exactly? Well, first I take a top down approach and review every industry group within each aggressive sector - technology, industrials, financials and consumer discretionary. Below are my favorites in each of these sectors... |
|
|
|
|
Bookstore Special
|
|
|
|
by John Hopkins
|
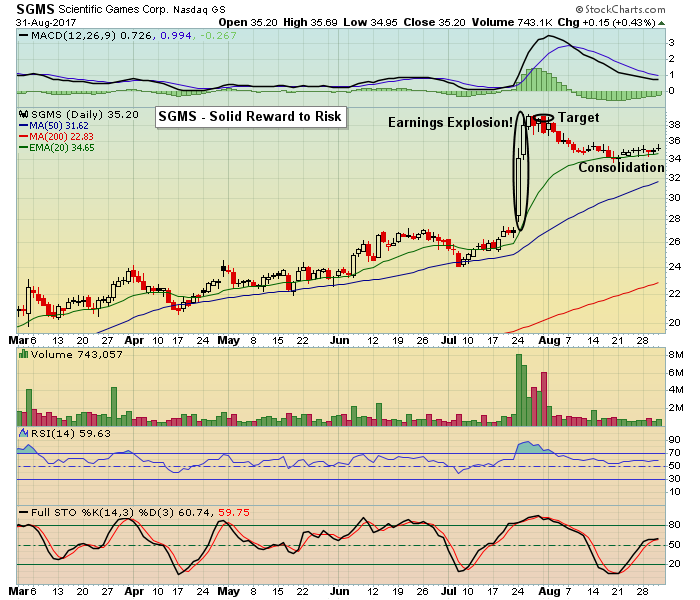 |
Q2 earnings season has come and gone and traders liked what they heard and saw. This is the primary reason the market has come to life, in spite of some things going on out there that might normally spook the market. For those of you out there who don't know what we do at EarningsBeats it's actually a simple - but powerful - concept. We scan for companies that beat earnings expectations, have... |
|
|
|
|
|
|
by Erin Heim
|
 |
As I prepared for the MarketWatchers LIVE segment on sentiment today, I was surprised to see investors and money managers are getting very bearish. Put/Call ratios show a bearish bias as well. It is important to remember that sentiment is a "contrarian" indicator. It works a bit like the VIX which more of you may be familiar with. When the VIX begins showing climactically higher readings, that |
|
|
|
 |
|
|
|
by Gatis Roze
|
 |
Upfront, it's important to note that unlike most investors who hear asset allocation and conjure up three asset baskets (stocks, bonds, cash), Tensile Trading presents an exhaustive all-inclusive buffet of 59 different asset classes from which you choose... |
|
|
|
|
|
|
|
|
|
Unlock All of Our
Tools and Features
- + Larger, Full-Screen Chart Sizes
- + Intraday Charts with Real-Time Data
- + Exclusive, Members-Only Commentary
- + Custom Technical Scans and Alerts
|
|
|
|
|
 |
|
|
|
ChartWatchers is our free, twice-monthly newsletter for online investors and StockCharts users. Whether you are brand new to charting or a seasoned analyst, each edition of ChartWatchers brings you insightful, expert commentary from the industry's leading technicians. See what's really happening in the markets through their eyes and gain an edge in your own investing.
|
|
|
|
|
|
| For more information about the ChartWatchers Newsletter or to subscribe for free, Click Here |
This email was sent to [email]. Need the newsletter sent to a different email address?
Simply unsubscribe your current email, then re-subscribe using the new address. |
| Click Here to instantly unsubscribe |
|


