 |
|
Expert Technical Commentary Delivered Straight To Your Inbox
|
| September 16, 2017 |
Hello Fellow ChartWatchers!
Welcome to the latest edition of ChartWatchers, the newsletter for technical analysts, online investors, StockCharts users and more. In addition to this week's articles, don't forget to check out the Site News section (below) for some important announcements and updates about what's going on around StockCharts this month!
Until next time,
- Grayson Roze
Having trouble viewing this email? Click Here to view online
|
|
|
|
NEW! Mini Charts now on Summary and SCTR Pages!
Yesterday, we added a valuable new "Mini Charts" feature to two of our summary pages: the Summary View for ChartLists, and the SCTR Summary. The new Mini Charts feature allows you to quickly view a small chart of any symbol in the table, right from that page. By eliminating the need to jump back and forth between the table page and the SharpCharts Workbench, we've made our summary tables much more dynamic to help you save precious time!
For example, if you have a saved ChartList of stocks that you're watching closely, you can now preview the chart of each stock while you skim the performance data in the Summary View table. Or, if you're browsing the SCTR rankings to find new buying opportunities, you can take a quick glance at the chart of each stock without ever having to leave the page.
To see the new mini charts feature in action, first pull up the Summary View for any of your saved ChartLists. Hover your cursor over one of the symbols in the table, and voila! The chart for that symbol will automatically appear on your screen. Alternatively, head over to our SCTR Summary page, which is now equipped with the same mini charts feature. (plus, look for this feature to roll out on some of our other table-focused pages in the coming weeks!)
Now, what do these two pages have in common? Well, they're reserved exclusively for StockCharts Members, just like many of our other most powerful features. Get started today with our FREE 1-month trial and explore all that StockCharts Membership has to offer!
|
|
|
|
|
|
|
by John Murphy
|
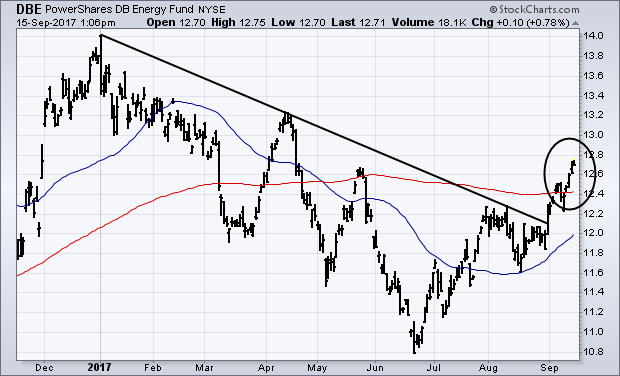 |
ENERGY ETF REACHES FIVE-MONTH HIGH ... It was reported Thursday that the headline CPI for August rose 0.4% from the previous month, which was its biggest monthly gain since January. That boosted its year-over-year comparison to 1.9%, which is just shy of the Fed's target of 2% inflation. The biggest reason for that jump was a 2.8% monthly gain in the price of gasoline. The core CPI |
|
|
|
|
|
|
by Arthur Hill
|
 |
We all know what a trend line is, but does a trend line actually dictate the trend? In other words, does a trend line break actually signal a trend reversal? Or, is a trend line break telling us something else? We cannot use a tool unless we fully understand it and this article will shed some light on the humble trend line. At the very least, I hope to stimulate the analysis process by... |
|
|
|
 |
|
|
|
by Greg Schnell
|
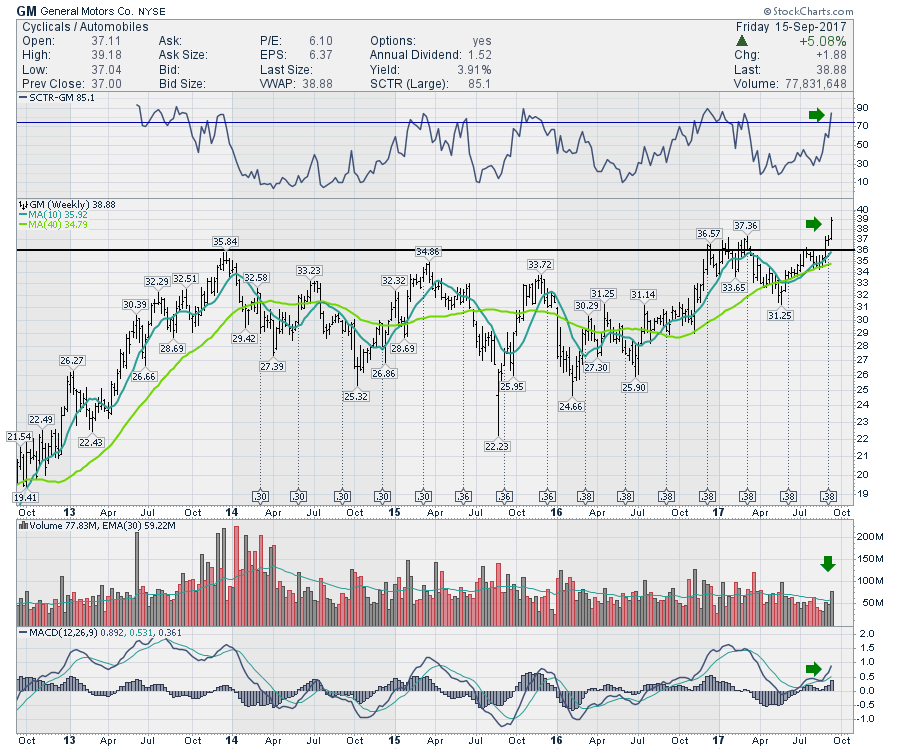 |
In the wake of the devastation of Hurricane Harvey and Hurricane Irma, a lot of cars were flooded. When scrolling through the auto charts, a few were breaking some trend lines this week. GM is pushing to new highs since basing for 4 years between $23 and $36. Toyota broke a 2-year trend line and closed near the highs of the week. There is some horizontal resistance at $124 when trying to push |
|
|
|
|
|
|
by Tom Bowley
|
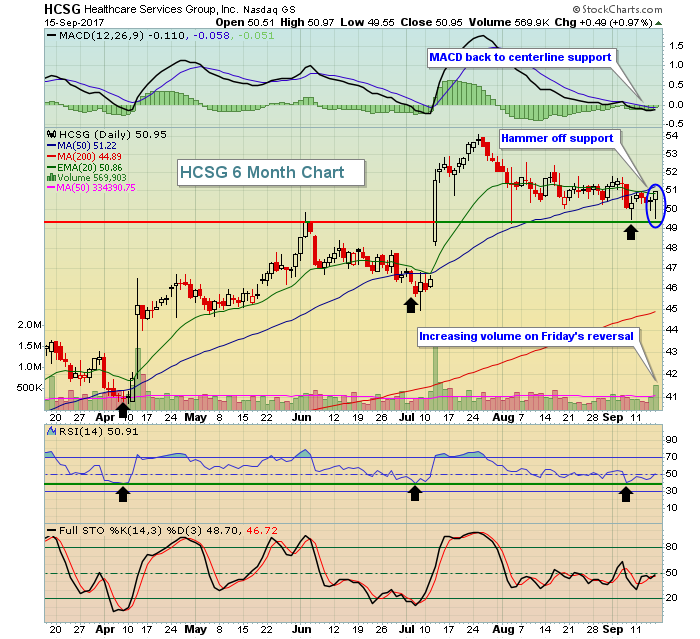 |
If only it was that easy, right? The problem many times is that a company that reports great results one quarter fails to do so the next. But my strategy is to find companies that not only reported great results in the prior quarter, but also showed major accumulation at the time, and just after, that earnings report was released. Analyzing the volume is critical during... |
|
|
|
|
Bookstore Special
|
 |
|
|
|
by John Hopkins
|
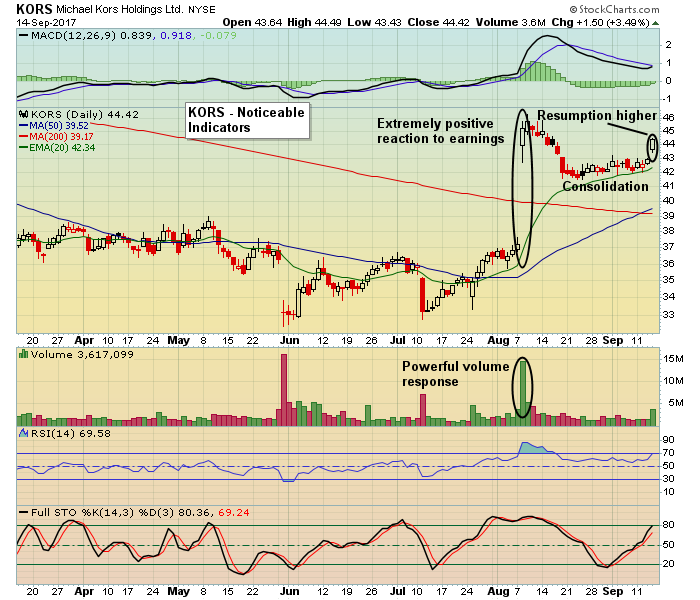 |
One of the benefits of technical analysis is being able to look at a chart to help determine if a stock is a viable trading candidate. In other words, what does a technician see in a chart that would lead to the conclusion that a specific stock is or isn't a high reward to risk trading candidate? I have found chart reading to be particularly useful after a company reports quarterly |
|
|
|
|
|
|
by Erin Heim
|
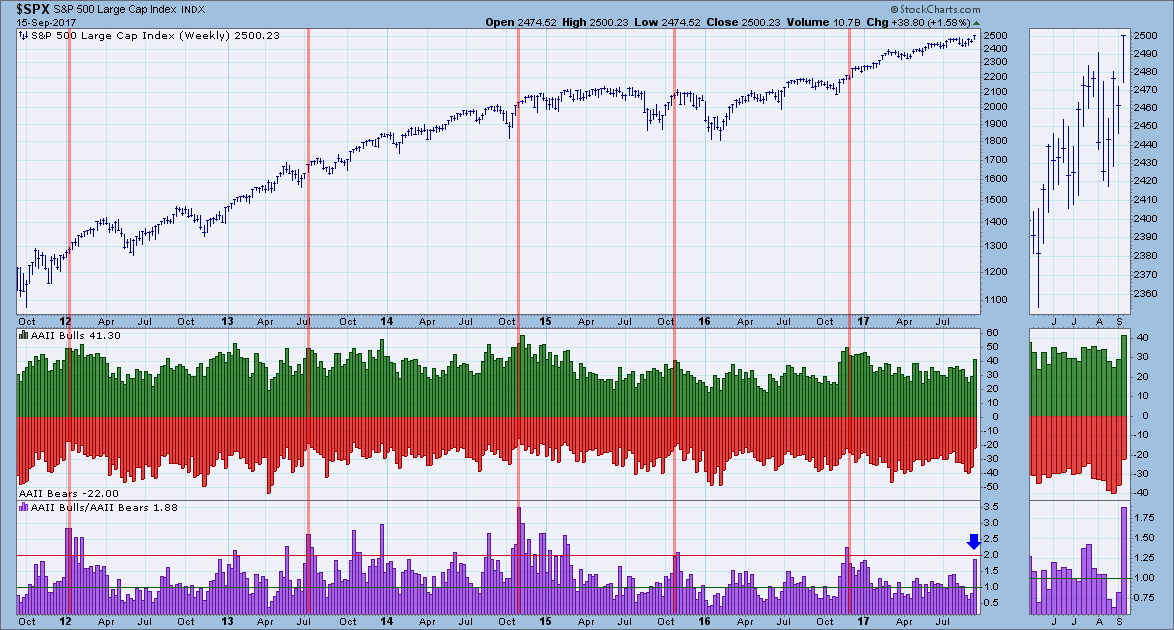 |
This week sentiment was mixed. Typically we see the American Association of Individual Investors (AAII) and National Association of Active Investment Managers (NAAIM) exposure index give the same message. However when I pulled up the charts to present during the sentiment segment of MarketWatchers LIVE, I saw the dissonance. The AAII sentiment survey asks individual investors whether they... |
|
|
|
|
|
|
by Gatis Roze
|
 |
I attend investment seminars as half-monk, half-hit man. My time is a precious commodity, so if you are a speaker and see me in the audience, be prepared. My hot button is when speakers show a few elaborate slides, "share" their four favorite tenets to successful investing and then launch directly into their marketing pitch. They act as if they've given you the keys to the... |
|
|
|
|
|
|
|
|
|
Unlock All of Our
Tools and Features
- + Larger, Full-Screen Chart Sizes
- + Intraday Charts with Real-Time Data
- + Exclusive, Members-Only Commentary
- + Custom Technical Scans and Alerts
|
|
|
|
|
 |
|
|
|
ChartWatchers is our free, twice-monthly newsletter for online investors and StockCharts users. Whether you are brand new to charting or a seasoned analyst, each edition of ChartWatchers brings you insightful, expert commentary from the industry's leading technicians. See what's really happening in the markets through their eyes and gain an edge in your own investing.
|
|
|
|
|
|
| For more information about the ChartWatchers Newsletter or to subscribe for free, Click Here |
This email was sent to [email]. Need the newsletter sent to a different email address?
Simply unsubscribe your current email, then re-subscribe using the new address. |
| Click Here to instantly unsubscribe |


