 |
|
Expert Technical Commentary Delivered Straight To Your Inbox
|
| February 17, 2018 |
|
Hello Fellow ChartWatchers!
Welcome to the latest edition of ChartWatchers, the newsletter for technical analysts, online investors, StockCharts users and more. In addition to this week's articles, here are a few important announcements for you:
ChartSchool Gets a Big Refresh!
We've recently made some powerful upgrades and improvements to ChartSchool, our extensive educational resource for investors, traders, and technical analysts of all levels. In particular, we've reorganized and reformatted the ChartSchool home page, making it easier to browse the complete content library and find the articles that will help you become a better investor.
Click Here to explore the new-and-improved ChartSchool!
Until next time,
|
|
|
|
Having trouble seeing this email? Click to view online
|
|
|
|
|
|
|
Recent Pullback in Commodities Is Likely Tied to Stock Correction
by John Murphy
|
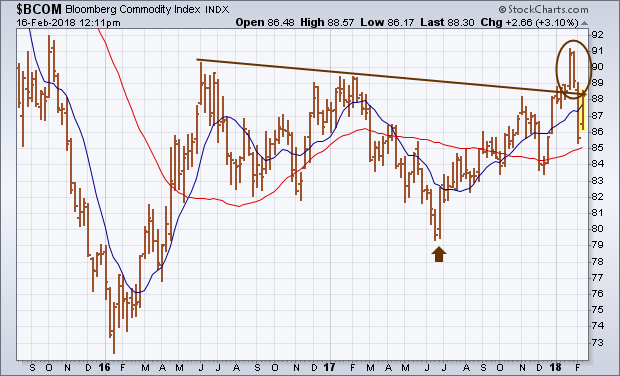 |
My January 27 message wrote about a bullish breakout in commodity prices to the highest level in two years. I took that as another sign that inflation pressures were starting to build. The weekly bars in Chart 1 show that bullish breakout taking place in the Bloomberg Commodity Index (circled area). During February, however, commodity prices have sold off enough to call that upside breakout
|
|
|
|
|
|
|
Where Did All Those New Lows Come From?
by Arthur Hill
|
 |
Stocks rebounded this week as the S&P 500 Equal-Weight Index ($SPXEW) recovered most of the losses from the previous week. On a closing basis, the index fell around 10% in nine days and then recovered around half of this loss with a 5.4% gain the last six days What a ride! Despite the strong recovery, the 10% decline did some technical damage and I was surprised by the
|
|
|
|
|
|
|
Natural Gas In February - Yes Really
by Greg Schnell
|
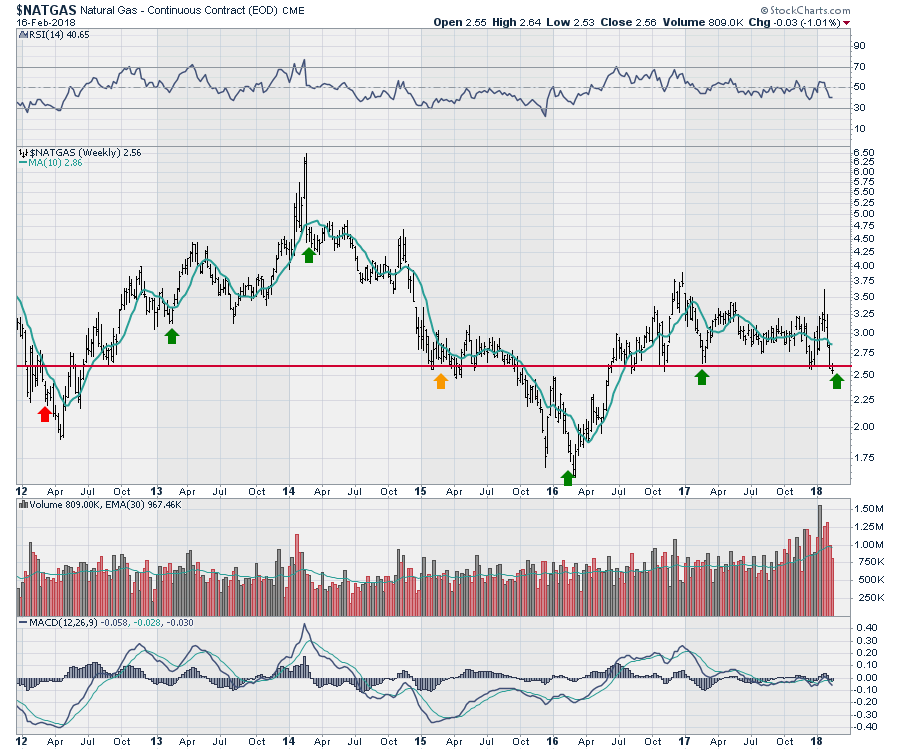 |
Natural Gas has been testing the $2.60 level for two weeks now. I have placed arrows around the centre of the first quarter in each of the last six years. By watching Natural Gas closely right now, there can be a great 4-6 week trading opportunity that is not correlated to the equity market indexes. Zooming in on the daily, Natural Gas is testing the lows. I have included the Commodity...
|
|
|
|
|
|
|
History And Fibonacci Say We Topped On Friday
by Tom Bowley
|
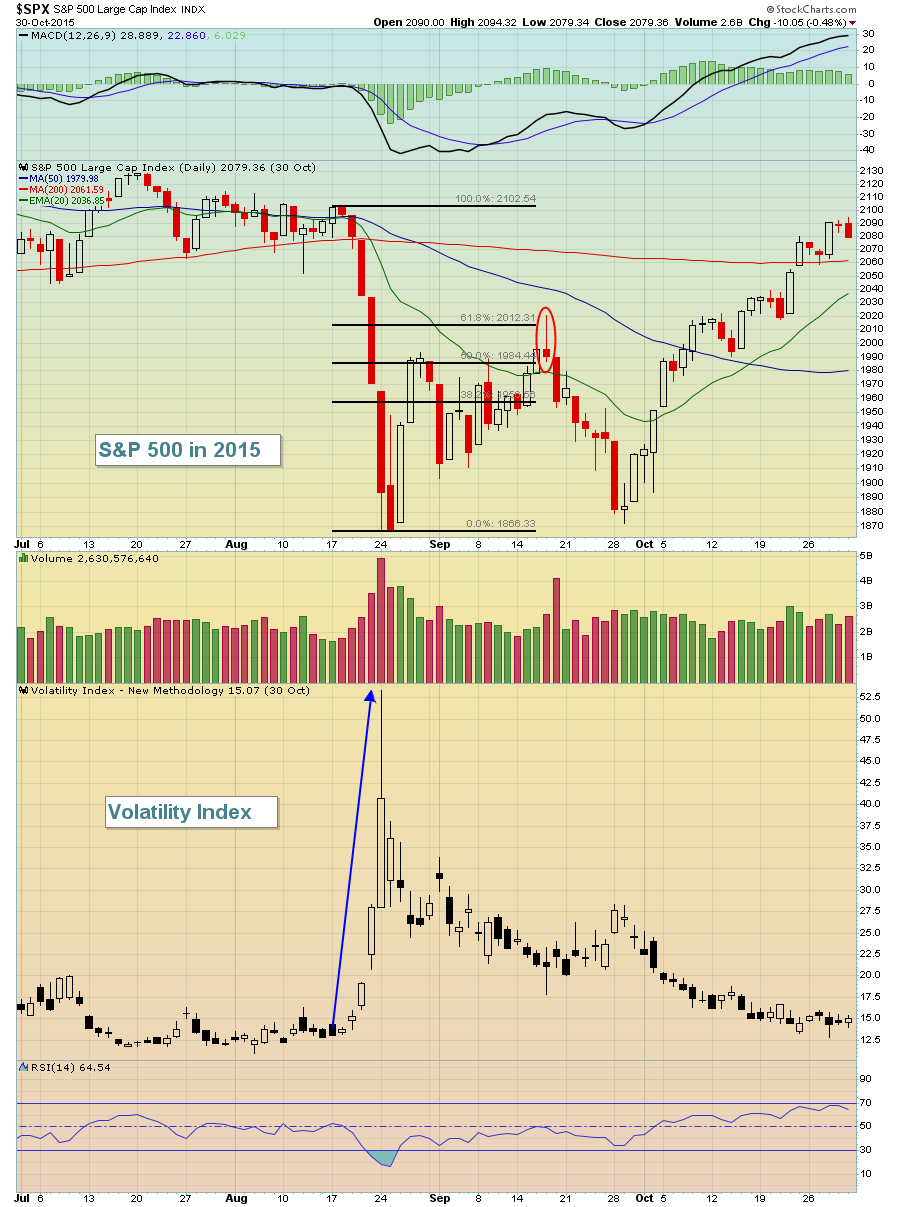 |
Fear ramped up with the early February selling and a capitulatory bottom (at least short-term) printed. The Volatility Index ($VIX) doesn't hit the 40-50 zone often and, when it does, it typically coincides with a panicked selloff and bottom. The last time we saw panicked selling (before the past few weeks) was in August 2015. Let's take a trip down memory lane: The drop was a...
|
|
|
|
 |
|
|
|
Big Scores Made Possible through Extreme Patience
by John Hopkins
|
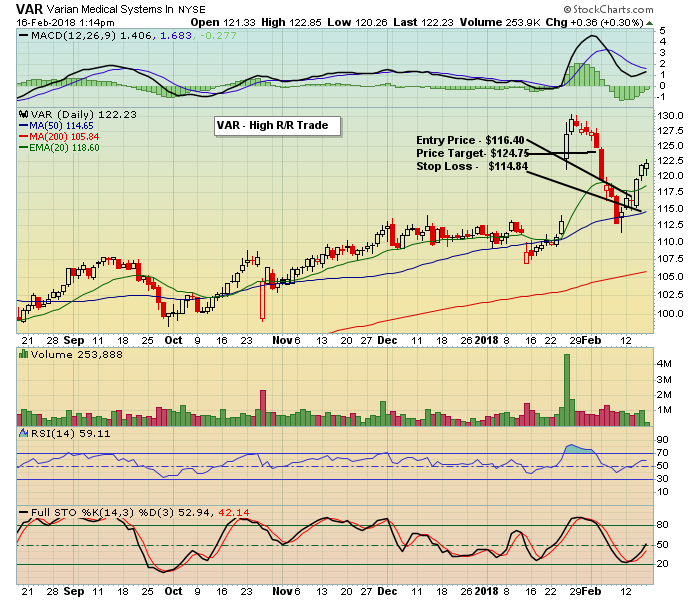 |
I'm sure most traders get tired of being told to be patient when the market or a specific stock is climbing day after day. Missing out on nice rallies can be extremely frustrating. But if there ever was a time when patience paid off big time it was over the past few weeks. Before I share the results of some recent trade results with you I want to point out our formula at Earnings Beats, because...
|
|
|
|
|
Bookstore Special
|
 |
|
|
|
Two Icons Reveal the Same Secret to Success
by Gatis Roze
|
 |
Steve Jobs famously challenged everyone when he said, "We're here to put a dent in the universe. Otherwise, why else be here?" I was fortunate recently to spend a couple of days in Napa Valley at the DENT 2018 conference. There's nothing like spending quality time with lots of exceptional people to get oneself re-energized and refocused...
|
|
|
|
|
|
|
Bull or Bear Market Rules?
by Erin Swenlin
|
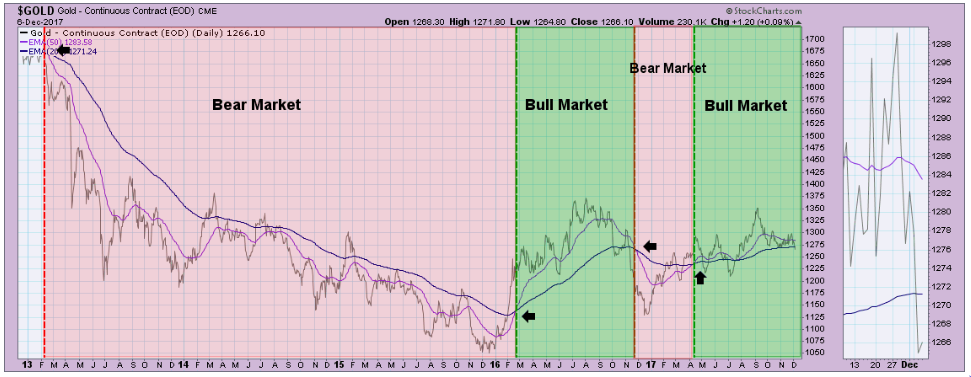 |
Today on MarketWatchers LIVE, I did a workshop on bull and bear market rules. You'll hear many technicians discuss "bull market rules apply" or vice versa. The question is pertinent and timely right now. The jury is still out on whether we are about to enter a bear market phase but that doesn't mean that you don't want to think about 'bear market rules'. We are currently in a bull market. Based...
|
|
|
|
|
|
|
|
|
|
|
Unlock All of Our
Tools and Features
- + Larger, Full-Screen Chart Sizes
- + Intraday Charts with Real-Time Data
- + Exclusive, Members-Only Commentary
- + Custom Technical Scans and Alerts
|
|
|
|
|
 |
|
|
|
ChartWatchers is our free, twice-monthly newsletter for online investors and StockCharts users. Whether you are brand new to charting or a seasoned analyst, each edition of ChartWatchers brings you insightful, expert commentary from the industry's leading technicians. See what's really happening in the markets through their eyes and gain an edge in your own investing.
|
|
|
|
|
|
| For more information about the ChartWatchers Newsletter or to subscribe for free, Click Here |
This email was sent to [email]. Need the newsletter sent to a different email address?
Simply unsubscribe your current email, then re-subscribe using the new address. |
| Click Here to instantly unsubscribe |


