| Hello Fellow ChartWatchers |
First and foremost, a big big thank you to everyone for exploring StockChartsACP this past week! The flood of positive feedback from so many of you has been simply inspiring. I didn't think our team could feel any more energized than we did on launch day, but somehow you all made it happen.
In case you missed the big news, we just launched the official v1.0 of StockChartsACP, our new interactive, full-screen Advanced Charting Platform. Among many other powerful features of this all-in-one charting package, the platform brings you true dynamic charting with the ability to scroll back and forth through time, drag indicators and overlays up, down and around your charts, manipulate the y-axis with your cursor and much more. In short, we've taken our award-winning approach to charting and dialed it up to 11.
There's tons to explore and lots to play with, so be sure to check out my announcement article from last week to learn more about all that's included in this latest version of ACP.
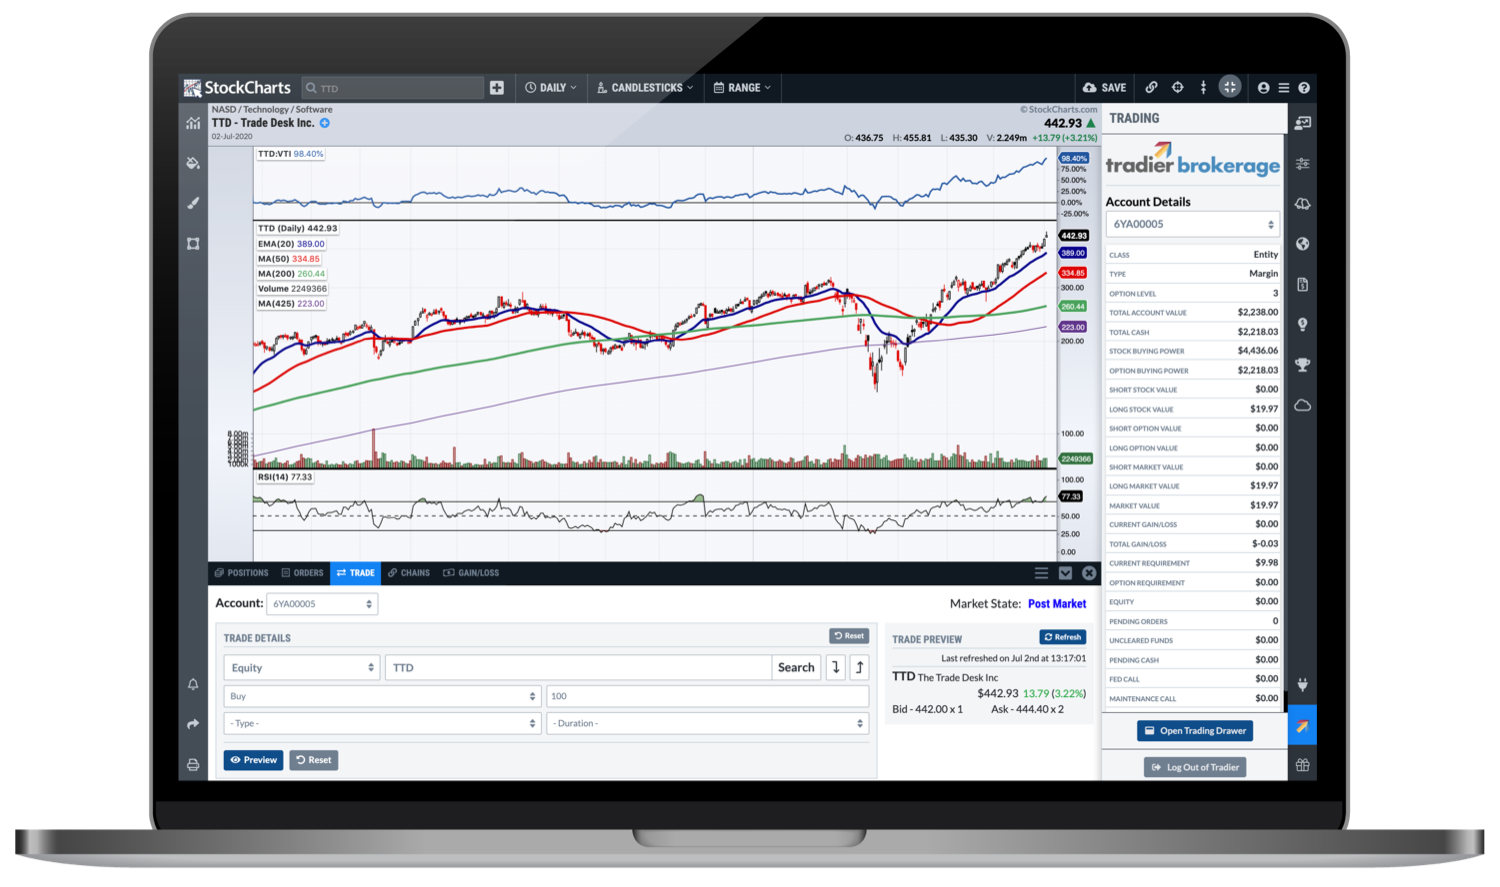
Now, one of the biggest additions to ACP that I want to highlight this week is the new trading integration. We've partnered with Tradier Brokerage to bring you unlimited, commission-free trading for US equities – directly from StockChartsACP.

As a StockCharts Member, you automatically qualify for FREE unlimited equities trading through Tradier. All you have to do is open a new account and you'll be able to start trading right from ACP. With Tradier, you can choose between Individual, Joint, Traditional IRA, and Roth IRA accounts. Tradier also offers unlimited options trading for a flat monthly subscription price, and we'll be adding options trading capabilities to StockChartsACP very soon.
Combined with the ability to trade directly from StockChartsACP, opening a Tradier Brokerage account today will bring you a seamless experience between analysis and action. You can learn more at StockCharts.com/tradier or Click Here to open your free Tradier Brokerage account now.
Oh! And one more thing...
Today at 12:00pm ET, we're closing out our week-long "Charting The Second Half" extravaganza on StockCharts TV with a big roundtable event. David Keller will host me, Greg Schnell, John Kosar and Julius de Kempenaer for a dynamic, fast-paced panel discussion. We'll talk markets, share charts and debate what's next for the remainder of 2020. Plus, we'll have an opportunity for you to join right in with a virtual Q&A session.
So, join us LIVE on StockCharts TV today at 12:00pm ET (or look for the recording on our official StockCharts YouTube channel after the panel airs). |
| Chart on, my friends. |
|
|
|
| THIS WEEK'S ARTICLES |
| Market Roundup |
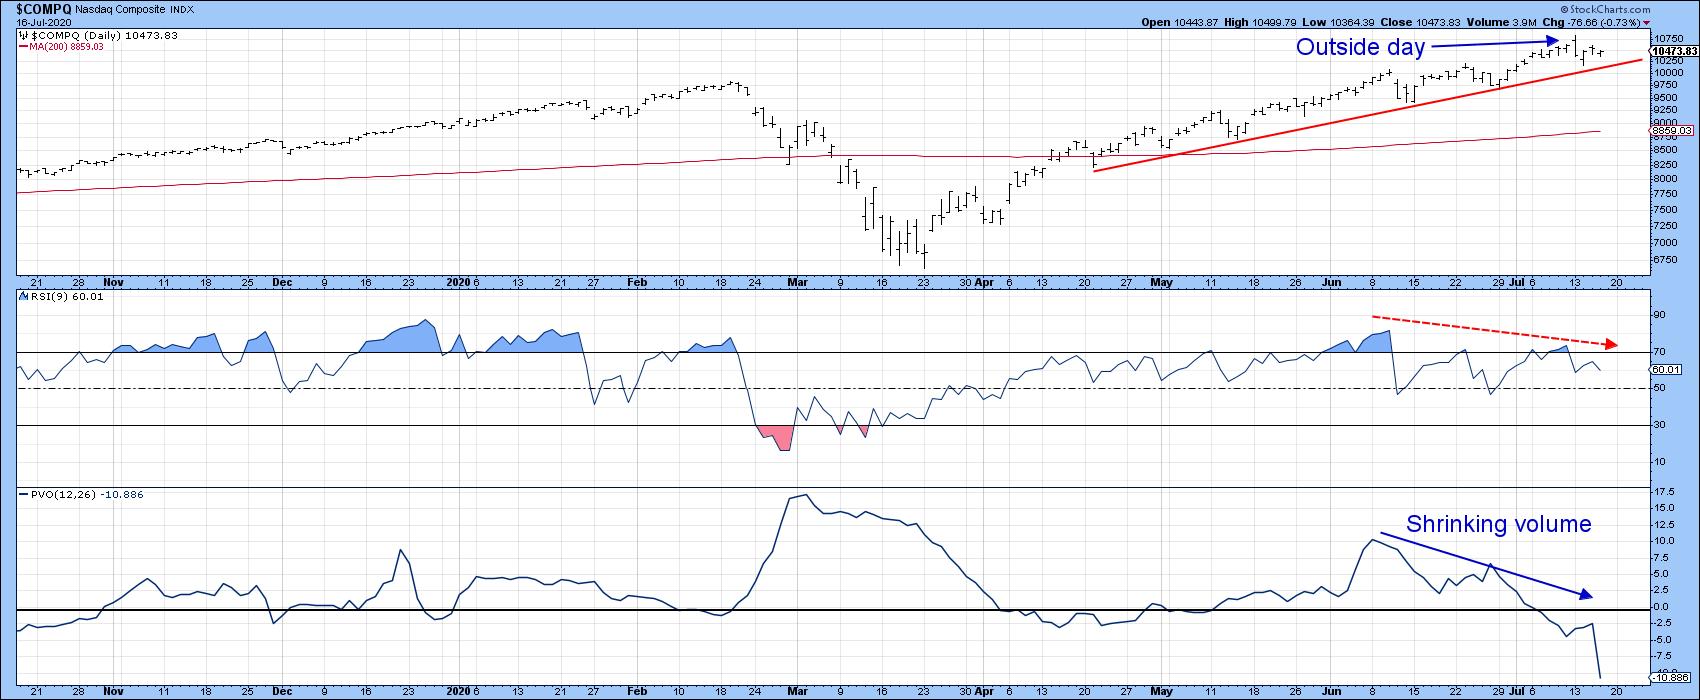
| New Sector Leadership May Be Emerging |
| by Martin Pring |
| Technology About to Pause? The undisputed king of sectors so far this year has been technology. This week's price action from the tech dominated NASDAQ Composite ($COMPQ), though, suggests that this leadership may be rotating elsewhere... |
|
|
|
|
|
| Art's Charts |
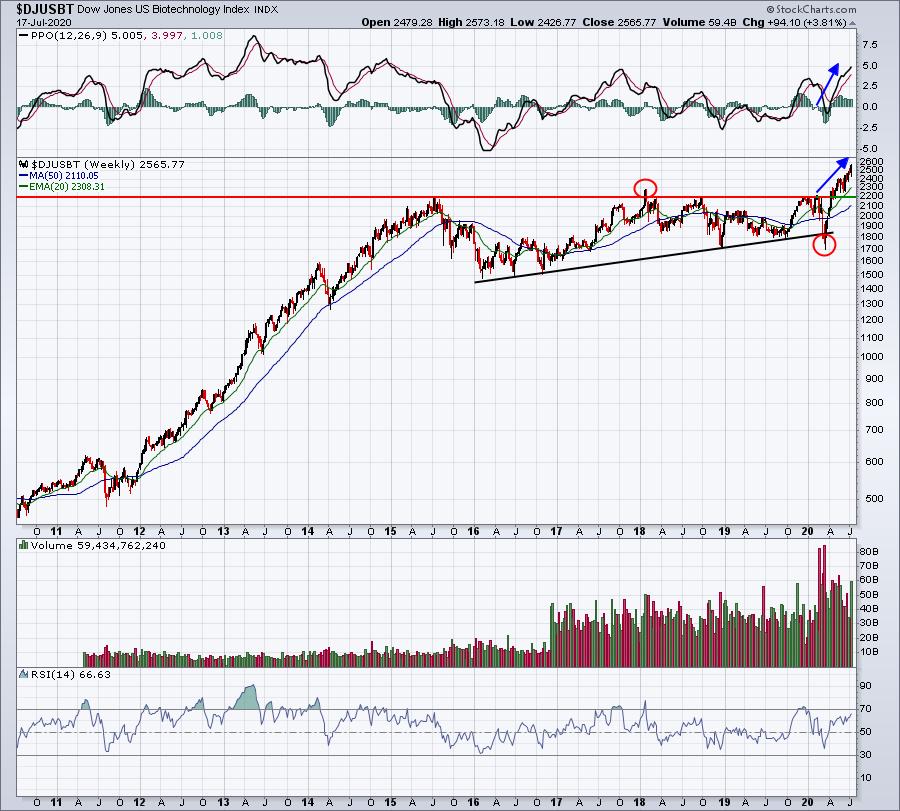
| A BB Breakout or the Dreaded Head Fake? |
| by Arthur Hill |
| There were a number of Bollinger Band squeeze plays over the last two weeks and also a number of breakouts. These breakouts are bullish until proven otherwise, but chartists should also be aware of the head fake... |
|
|
|
|
|
|
|
|
|
| RRG Charts |
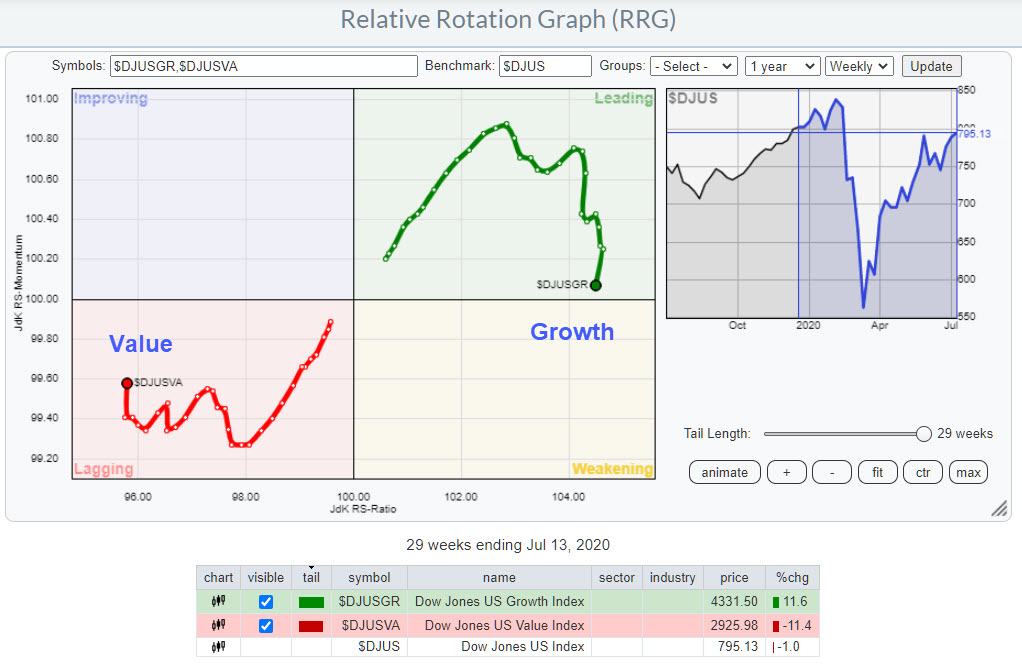
| What About Growth vs. Value Going into the Second Half? |
| by Julius de Kempenaer |
| The last time Value took over from Growth was at the end of 2018, and even that was only for a short period going into and following the Christmas Crash. But that situation rapidly reversed a few weeks into 2019, when the uptrend in the Growth-Value ratio continued strongly... |
|
|
|
|
|
| DecisionPoint |
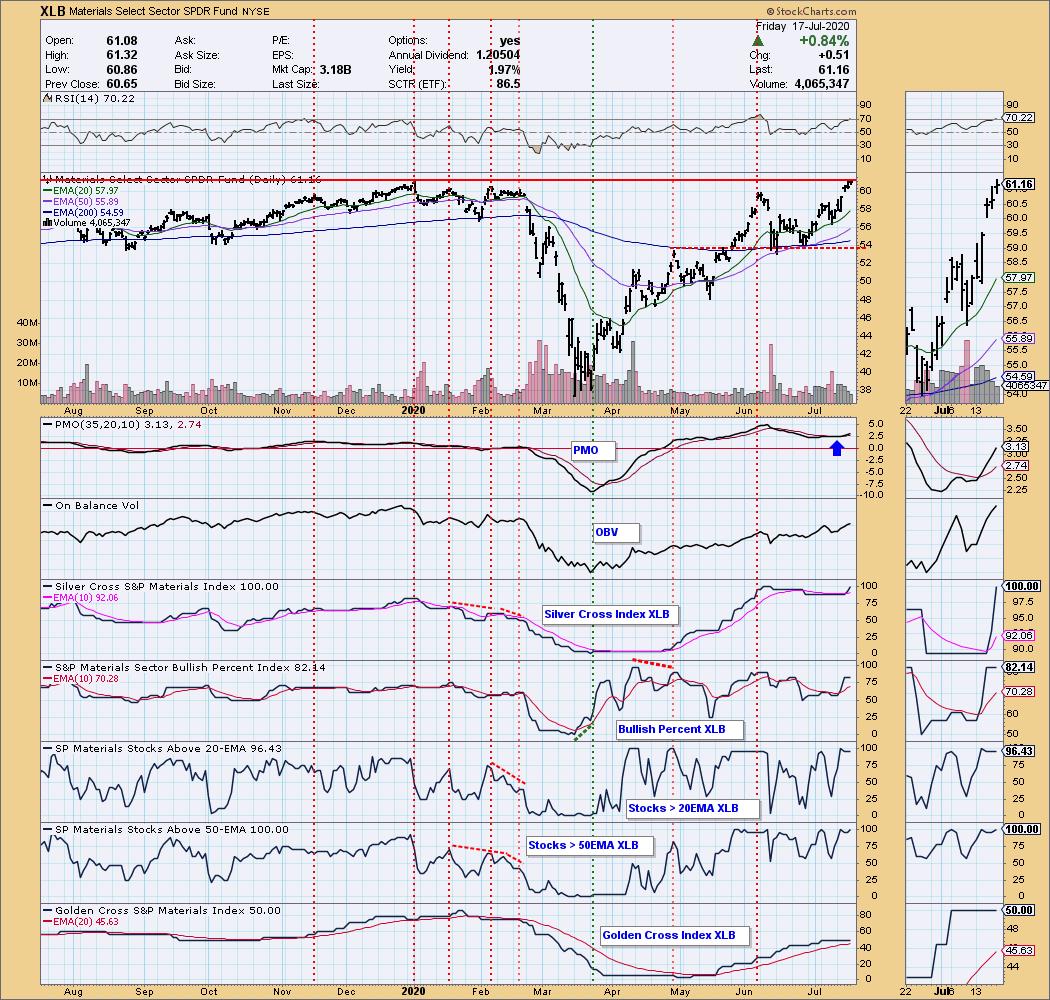
| The "Diamonds" of the Materials Sector |
| by Erin Swenlin |
| As part of my preparation of the "DecisionPoint Diamonds Report", I seek areas that are showing leadership, and the Materials sector has been doing just that. Materials was up 5.47% on the week, which was only second to Industrials at 5.87%... |
|
|
|
|
|
|
|
| MORE ARTICLES → |
|


