| Hey There Fellow ChartWatchers |
NEW CHART ALERT!
When we released our Sample Chart Gallery this past December, we promised to evolve the library with a steady stream of useful, pre-built chart templates that you can incorporate into your own process. We started with a wide collection of charts across different categories - investment strategies, trading styles, timeframes, breadth, volatility, economic indicators and many more.
Well, it's time to start expanding the collection. And what better way to do it than with a unique new chart layout crafted by David Keller, our very own Chief Market Strategist!
If you head over to the Sample Chart Gallery, you'll now find Dave's "Market Trend Model" chart listed under the Market Analysis section of the page. Using a variety of PPO settings, this powerful chart setup allows you to gauge and compare the long, intermediate, and short-term market trends for any index. It's a frequent feature of Dave's daily show on StockCharts TV, and you can now make it a part of your own review process.
Plus, I've got good news for all you ACP users! We've built Dave's Market Trend Model into a "Sample Layout" that you can easily pull up within the platform. Open the Layouts sidebar on the left and find the Keller Market Trend layout in the list (or simply click here to jump there now). |
| Chart on, my friends. |
| Grayson Roze |
VP of Operations, StockCharts.com
Author, Trading For Dummies
Author, Tensile Trading |
  |
|
|
| THIS WEEK'S ARTICLES |
| John Murphy's Market Message |
| MEMBERS ONLY |
| STOCK INDEXES HOLD 200-DAY LINES |
| by John Murphy |
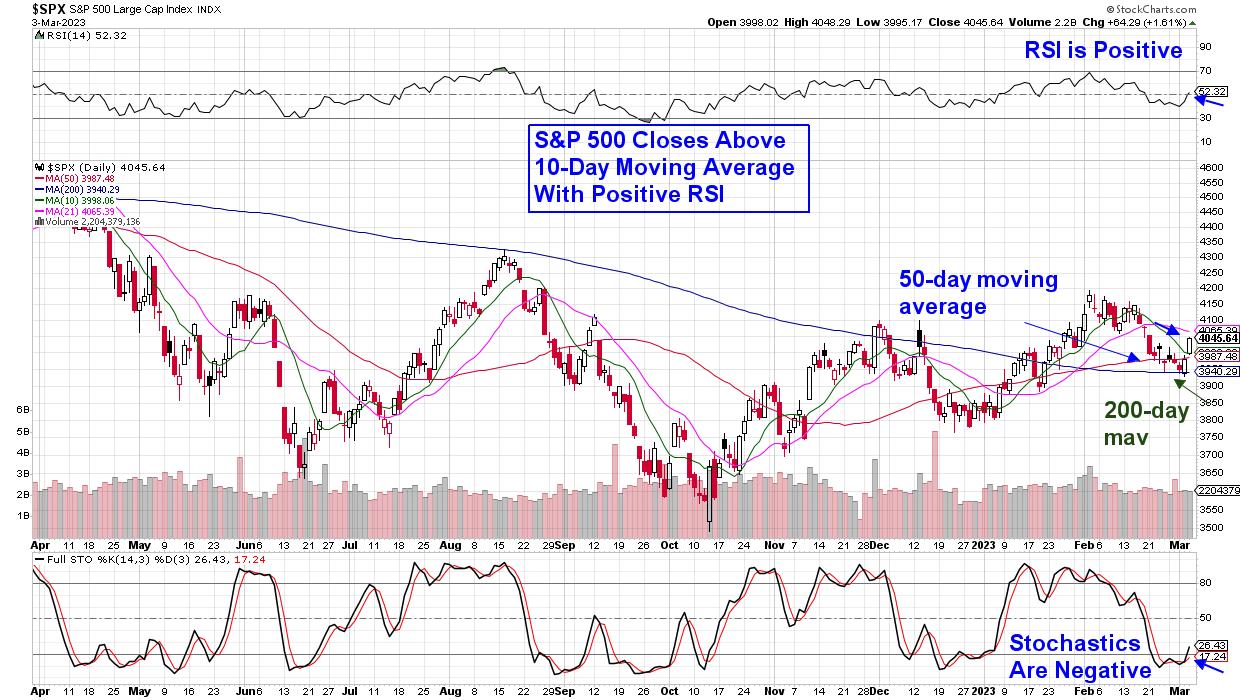
| STOCK INDEXES HOLD 200-DAY LINES...After a weak month of February, major stock indexes are finally attracting some new buying. More importantly, this week's rebound is happening at some important moving average lines... |
|
|
|
|
|
| The Mindful Investor |
| The Road to SPX 5000 |
| by David Keller |
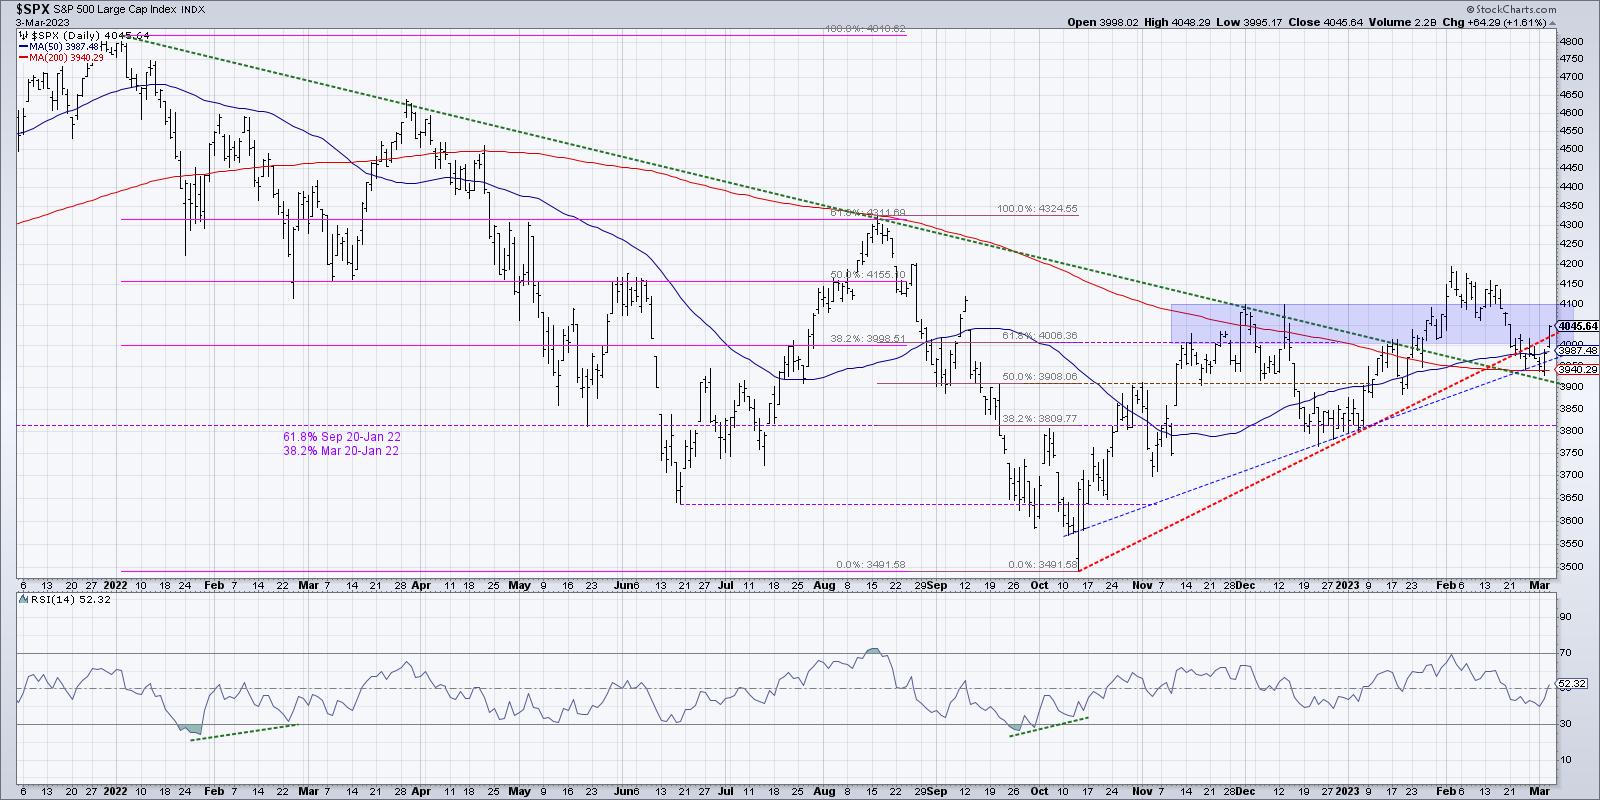
| My conversations with Chris Verrone, Adrian Zduńczyk, and Mary Ellen McGonagle this week on The Final Bar left me striving to simplify my analysis of the S&P 500. It's been a confusing time for stocks and as a result, my main daily chart of the S&P 500 has become much busier... |
|
|
|
|
|
|
|
|
|
|
|
|
|
| Don't Ignore This Chart! |
| Target: Poised for an Explosive Breakout? |
| by Karl Montevirgen |
| Target (TGT)'s stock has been bouncing back and forth within a wide eight-month trading range. This happened right after its -44% plunge between April and May last year. Since then, it's been stuck in a $45 range, forming an extremely long rectangle pattern... |
|
|
|
|
|
|
|
|
|
| MORE ARTICLES → |
|
|
|
| Risk Assets Power Higher Into Weekend | David Keller, CMT | The Final Bar (03.03.23) |
|
|
|
|
|
| Has Spring Sprung In The Market? | Jane Gallina | Your Daily Five (03.03.23) |
|
|
|
|
|
| Here Comes The Rotation! | Tom Bowley | Trading Places (03.02.23) |
|
|
|
|
|
| Is It Time For Gold? | Greg Schnell, CMT | Market Buzz (03.01.23) |
|
|
|
|
|
| Chart Reading the Wyckoff Way | Bruce Fraser | Power Charting (03.03.23) |
|
|
|
|
|
| UPCOMING GUESTS |
|
|
| WATCH LIVE → |
|


