| Hey There Fellow ChartWatchers |
Our scanning adventures continue!
If you've ever been intrigued, intimidated or puzzled by the technical scanning tools on StockCharts, this one is for you. On our latest edition of "StockCharts In Focus", we're bringing you a new beginner's guide to all things scanning.
Together we'll dig into one of my own custom "checklist" scans, breaking things down line by line to help you more clearly understand the way scans work on StockCharts. Along the way, you'll see how easy it can be to create your own custom scans without writing any syntax yourself thanks to the Scan Components section of the workbench.
Plus, at the end of the show, we'll take a closer look at some key resources that can help you learn more about advanced scanning, and we'll highlight two tools that you can use to start running scans in just a single click.
Click the thumbnail below to watch now!
 |
| Chart on, my friends. |
| Grayson Roze |
VP of Operations, StockCharts.com
Author, Trading For Dummies
Author, Tensile Trading |
  |
|
|
| THIS WEEK'S ARTICLES |
| John Murphy's Market Message |
| MEMBERS ONLY |
| STOCKS END WEEK LITTLE CHANGED |
| by John Murphy |
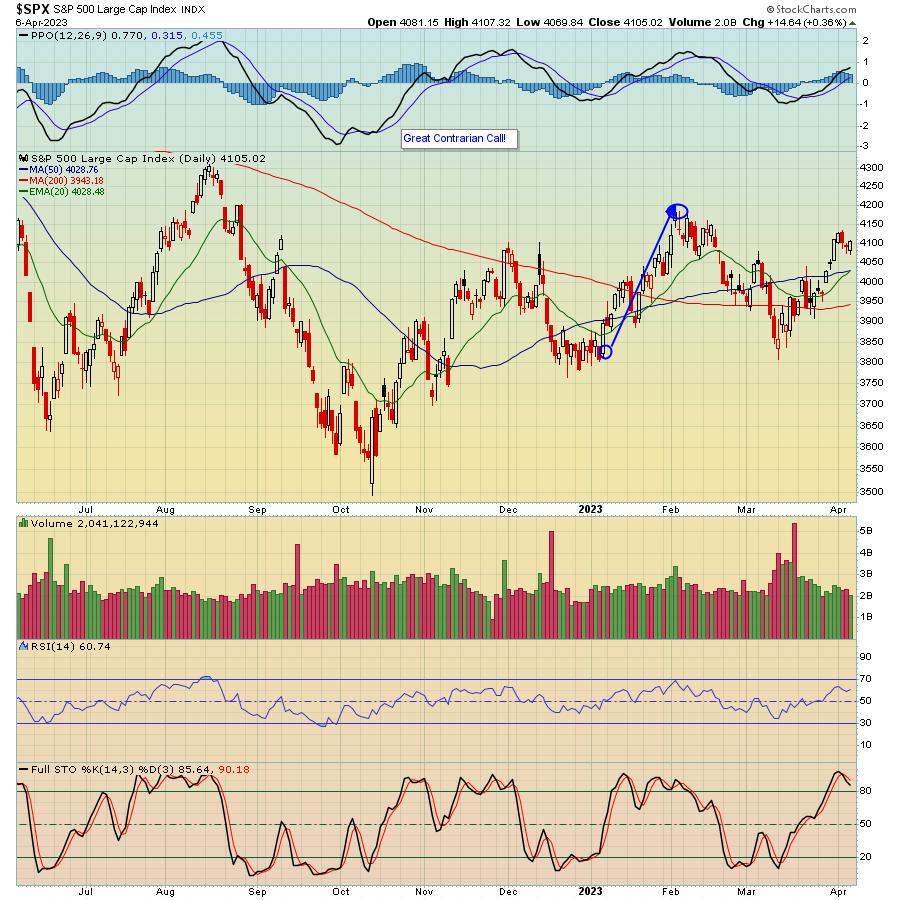
| EQUAL WEIGHTED SPX LAGS BEHIND...Stocks were little changed on the shortened trading week and have maintained their intermediate uptrend. The black bars in Chart 1 show the S&P 500 having reached the highest level in two months... |
|
|
|
|
|
|
|
| The Mindful Investor |
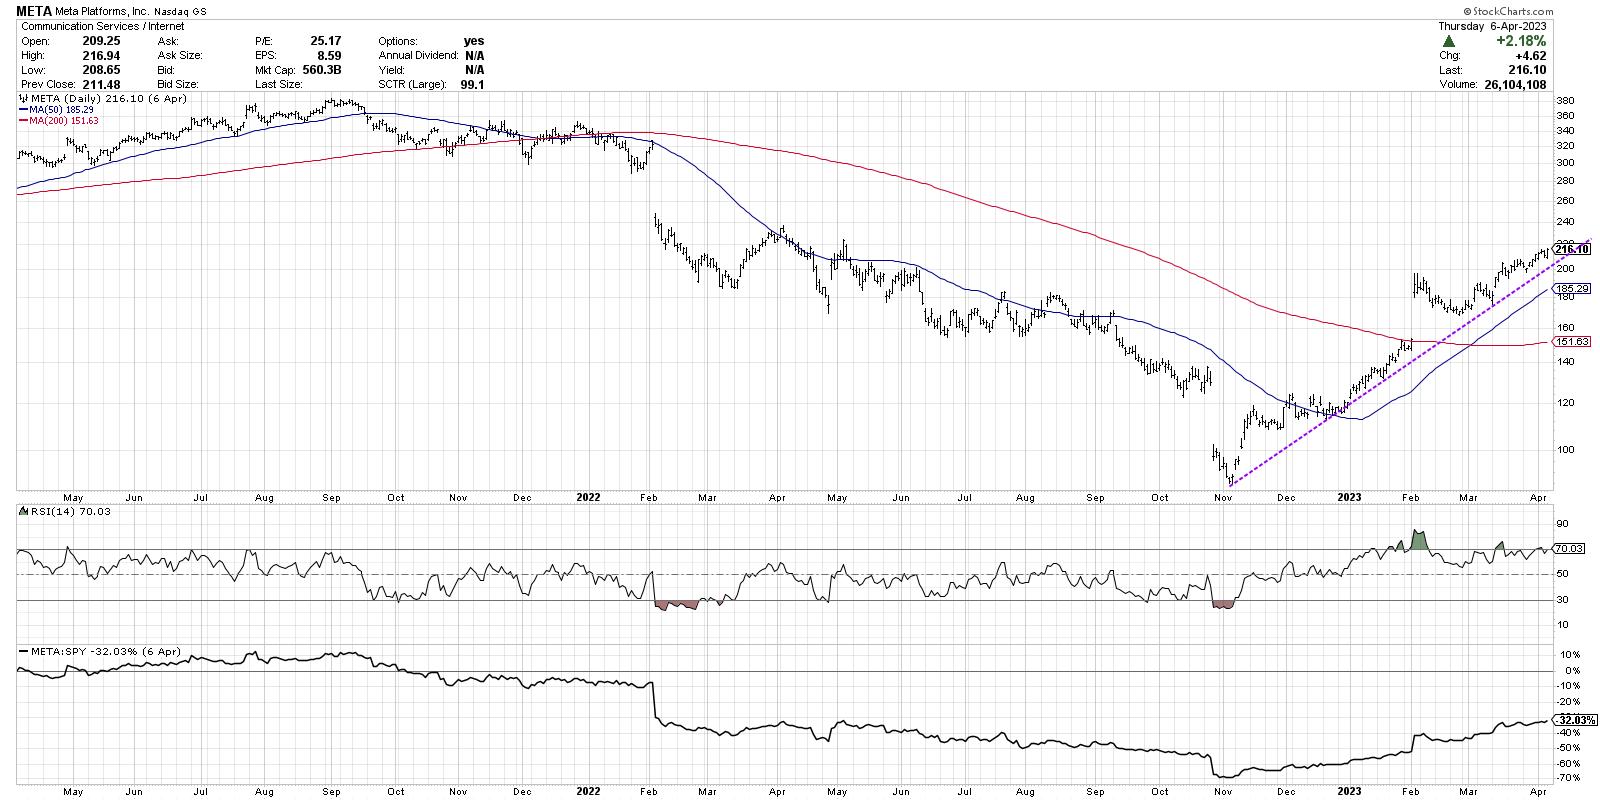
| Key Levels for the FAANG Stocks |
| by David Keller |
| A number of my conversations this week on The Final Bar dealt with the challenges presented by narrow leadership. Joe Rabil pointed out the weakness in small caps, and Jeff Huge focused on the difference between the YTD returns of FAANG stocks versus pretty much everything else... |
|
|
|
|
|
| Martin Pring's Market Roundup |
| MEMBERS ONLY |
| Market Faces Key Test |
| by Martin Pring |
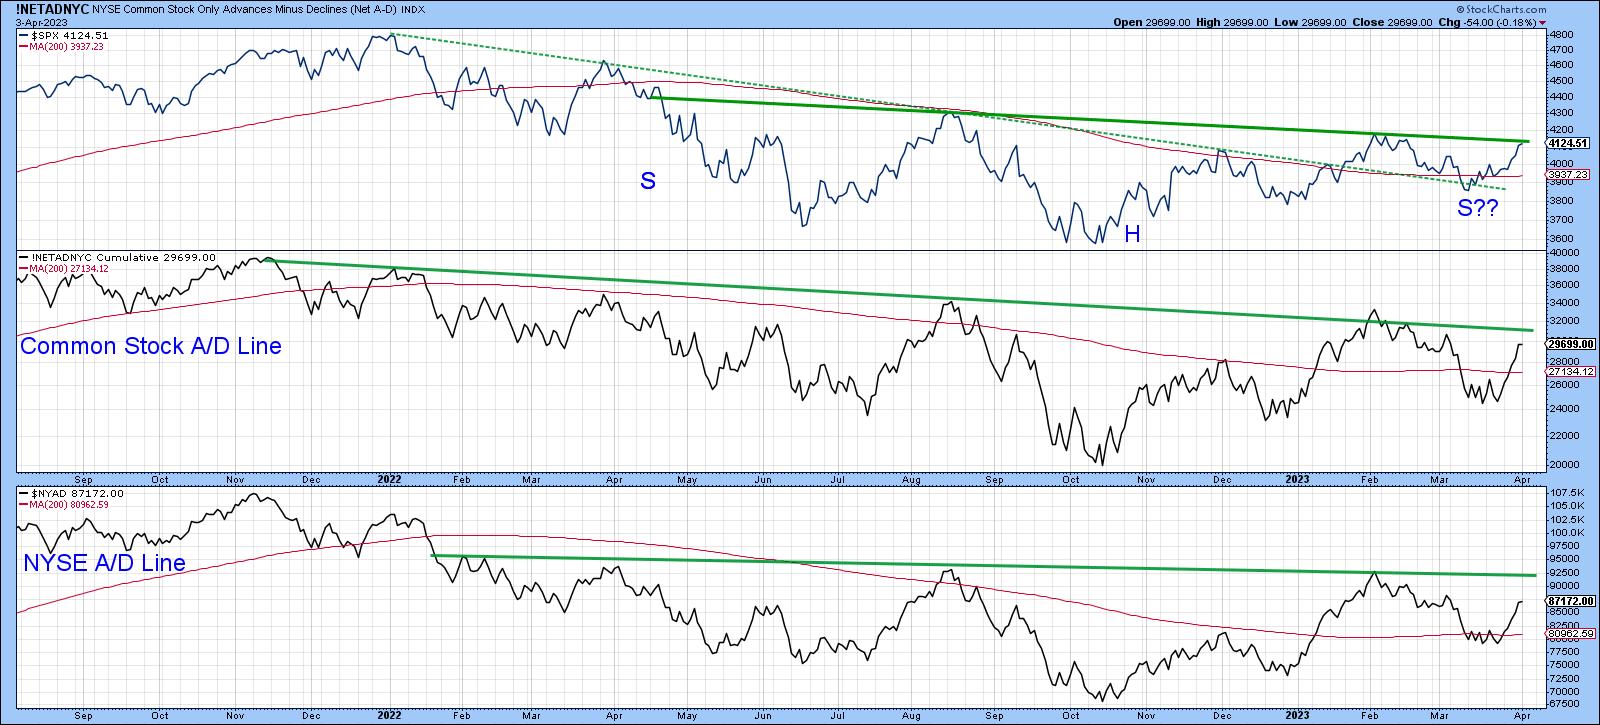
| Global equities have risen for the last three weeks and now are at or just below key chart points. Chart 1, for instance, shows that the S&P 500 index ($SPX) is close to breaking above resistance in the form of its 2022–23 down trendline... |
|
|
|
|
|
|
|
|
|
|
|
|
|
|
|
|
|
| MORE ARTICLES → |
|
|
|
| How Three StockCharts Experts Use Multiple Timeframes | David Keller, CMT | The Final Bar (04.07.23) |
|
|
|
|
|
| Powerful RSI Setup to Use During Corrections | Joe Rabil | Stock Talk (04.06.23) |
|
|
|
|
|
| These Trades Are Money Makers | Tom Bowley | Trading Places (04.06.23) |
|
|
|
|
|
| Recession Fears Drive Sector Rotation | Mary Ellen McGonagle | The MEM Edge (04.07.23) |
|
|
|
|
|
| Scanning Made Easy: A Beginner’s Guide To Custom Screens | Grayson Roze | StockCharts In Focus |
|
|
|
|
|
| UPCOMING GUESTS |
|
|
|
|
|
|
|
|
|
|
|
|
|
|
|
|
|
|
|
|
| April 20th |
| Dan Russo, CMT |
| Portfolio Manager & Director Of Research, Potomac Fund Management |
| Appearing On: The Final Bar (4:00pm ET) |
|
|
|
|
|
| WATCH LIVE → |
|


