Archived News
Analyzing India2mo ago
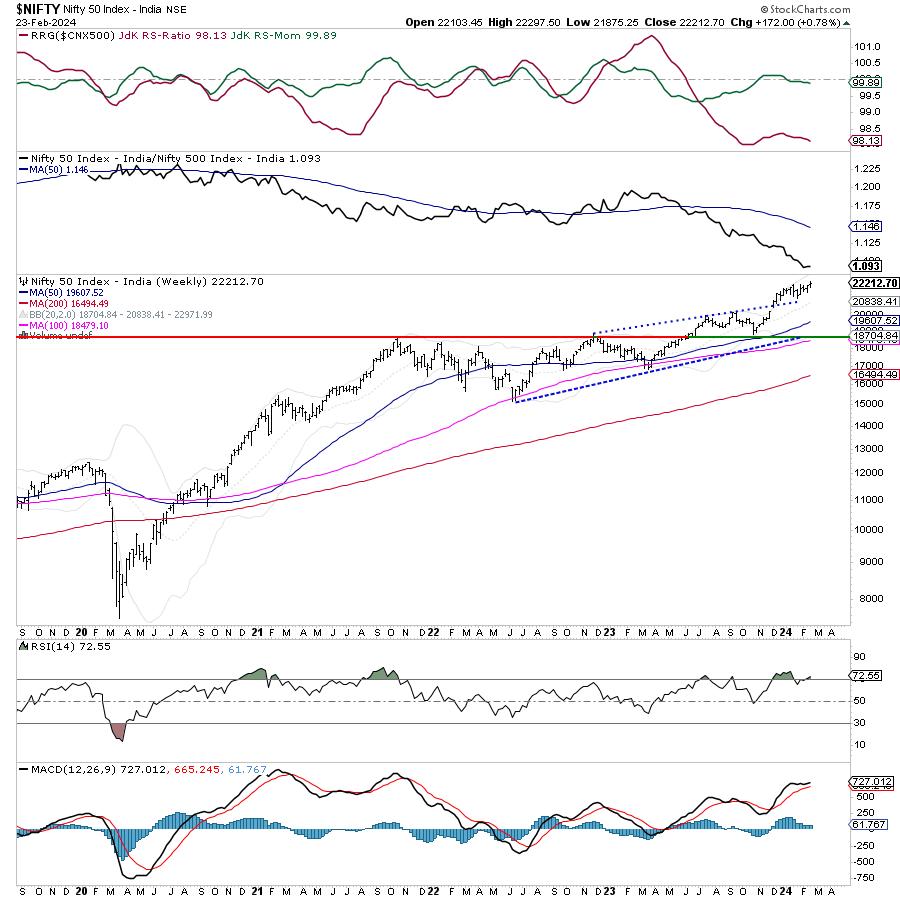
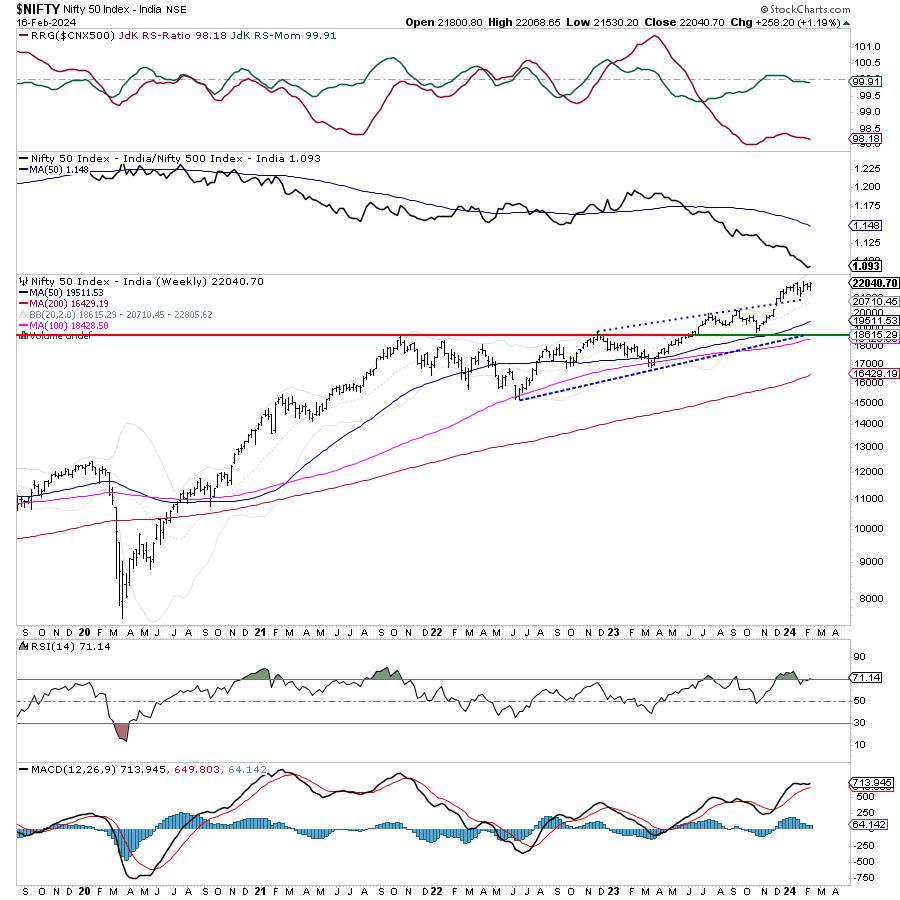
Week Ahead: NIFTY Likely to Continue Consolidating; Finding Relative Outperformance
In the previous technical note, it was categorically mentioned that, while the overall trend may stay intact, the markets could continue to largely consolidate. In line with the analysis, the markets kept consolidating, staying in a broad but defined trading range Read More
The Mindful Investor2mo ago
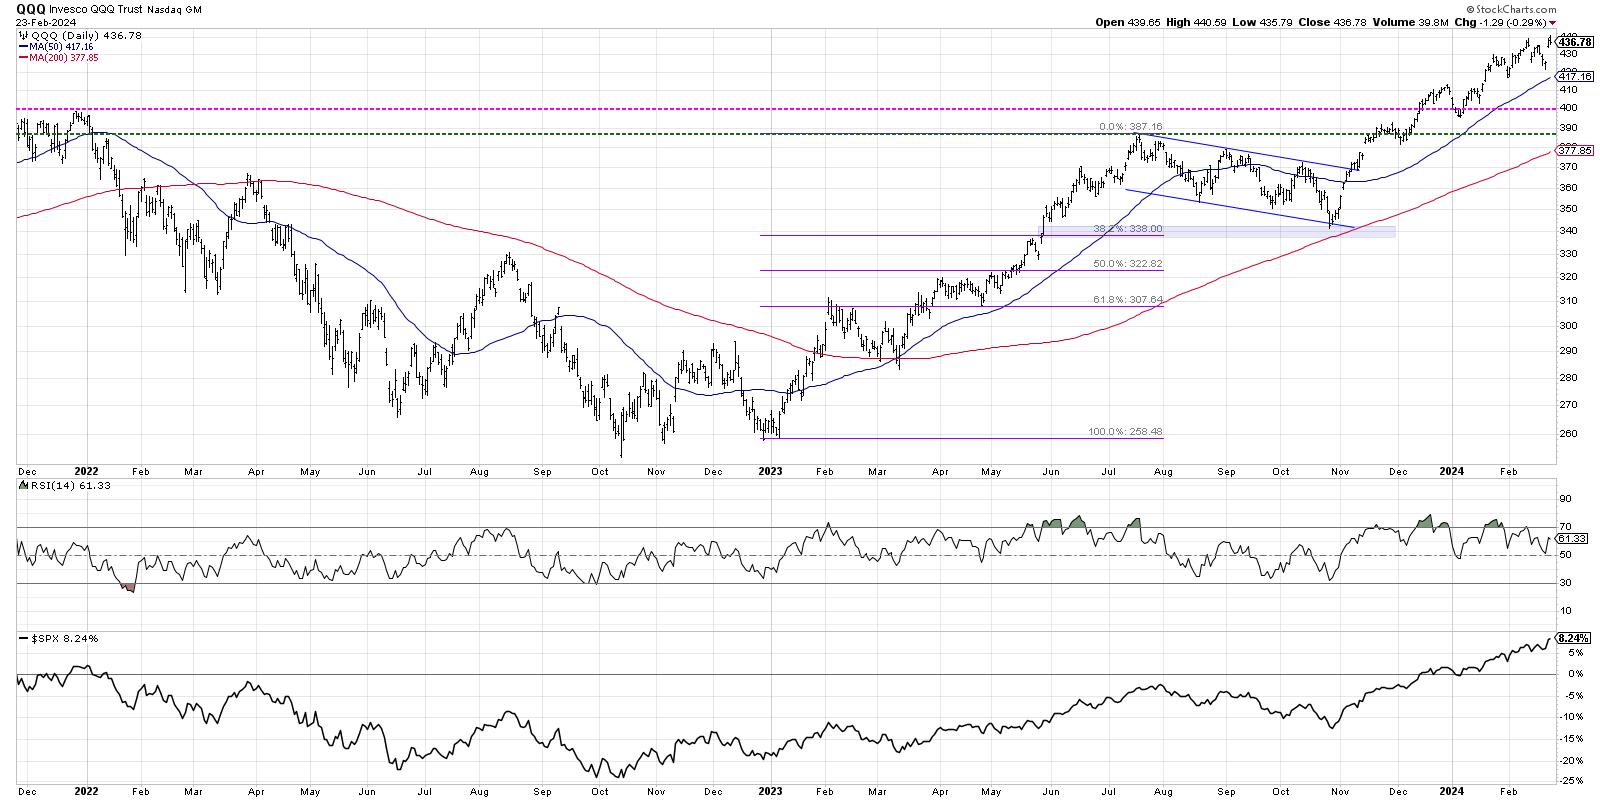
How Overextended Are You, QQQ?
We've highlighted all the warning signs as this bull market phase has seemed to near an exhaustion point. We shared bearish market tells, including the dreaded Hindenburg Omen, and how leading growth stocks have been demonstrating questionable patterns Read More
The MEM Edge2mo ago

MEM TV: Simple Way to Identify a Buy Point in NVDA
In this episode of StockCharts TV's The MEM Edge, Mary Ellen reviews what drove the markets to new highs and what areas are outperforming Read More
Don't Ignore This Chart!2mo ago
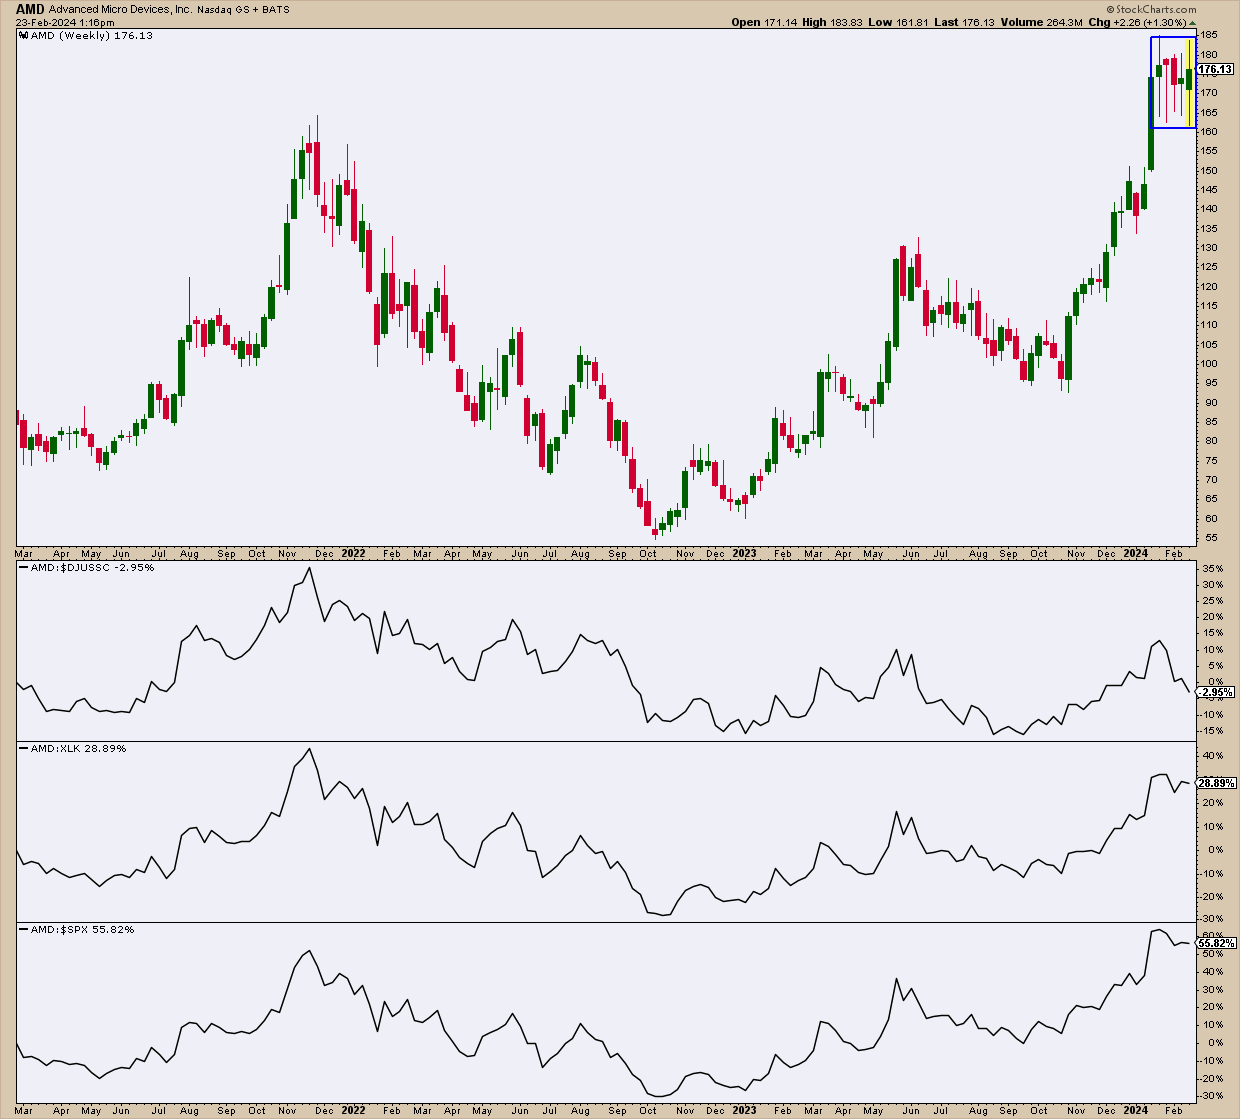
AMD's Sensational Halt — What You Need to Watch
If you ran a StockCharts Gap Ups scan on Thursday, chipmaker Advanced Micro Devices (AMD) would have come up on your list. The company might have missed Q4 2023 earnings expectations (though it beat on revenue), causing it to slump, but prices bounced quickly thereafter Read More
The Final Bar2mo ago

The Best Technical Indicator for Long-Term Investors
In this edition of StockCharts TV's The Final Bar, Dave drops an all-mailbag episode featuring viewer questions on the Hindenburg Omen, ascending triangle patterns, Fibonacci Retracements, projecting upside targets for stocks like NVDA, and the best technical indicator long-term Read More
ChartWatchers2mo ago
Is Energy About to Undergo a Strong Seasonal Sector Surge?
When we think about sector rotation, we think about fundamentally-based forecasts linked to the stages of the economic cycle (i.e. business cycle) Read More
The Final Bar2mo ago
NVDA SCREAMS BULL With Earnings Breakout
In this edition of StockCharts TV's The Final Bar, Dave identifies key resistance levels for QQQ and HYG, along with a technical analysis downtrend checklist for charts in confirmed bear phases Read More
ChartWatchers2mo ago

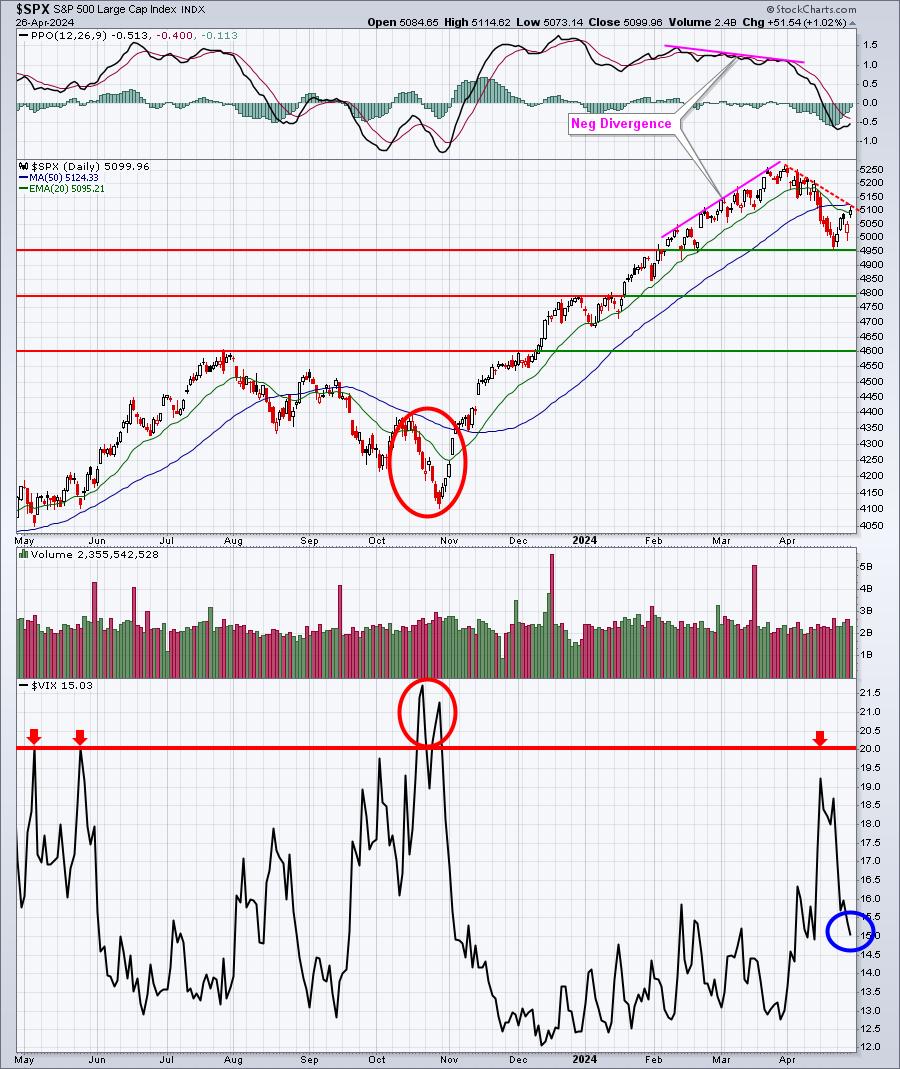
S&P 500's Sensational Rally Keeps On Going Thanks to NVDA — What You Need to Watch
Well, Nvidia did it! A stellar earnings report from NVDA brought back optimism in the stock market. When a stock rises around 15% (for NVDA, that's about a $100 rise in its price), it's an indication that investors still have tons of optimism Read More
Stock Talk with Joe Rabil2mo ago
3 Unique RSI Techniques to Maximize Your Investments
On this week's edition of Stock Talk with Joe Rabil, Joe dives into the world of technical analysis by sharing three unique ways to utilize the RSI indicator alongside MACD and ADX -- the Pullback Trade, Confirming a Breakout and 2nd Chance Entry Read More
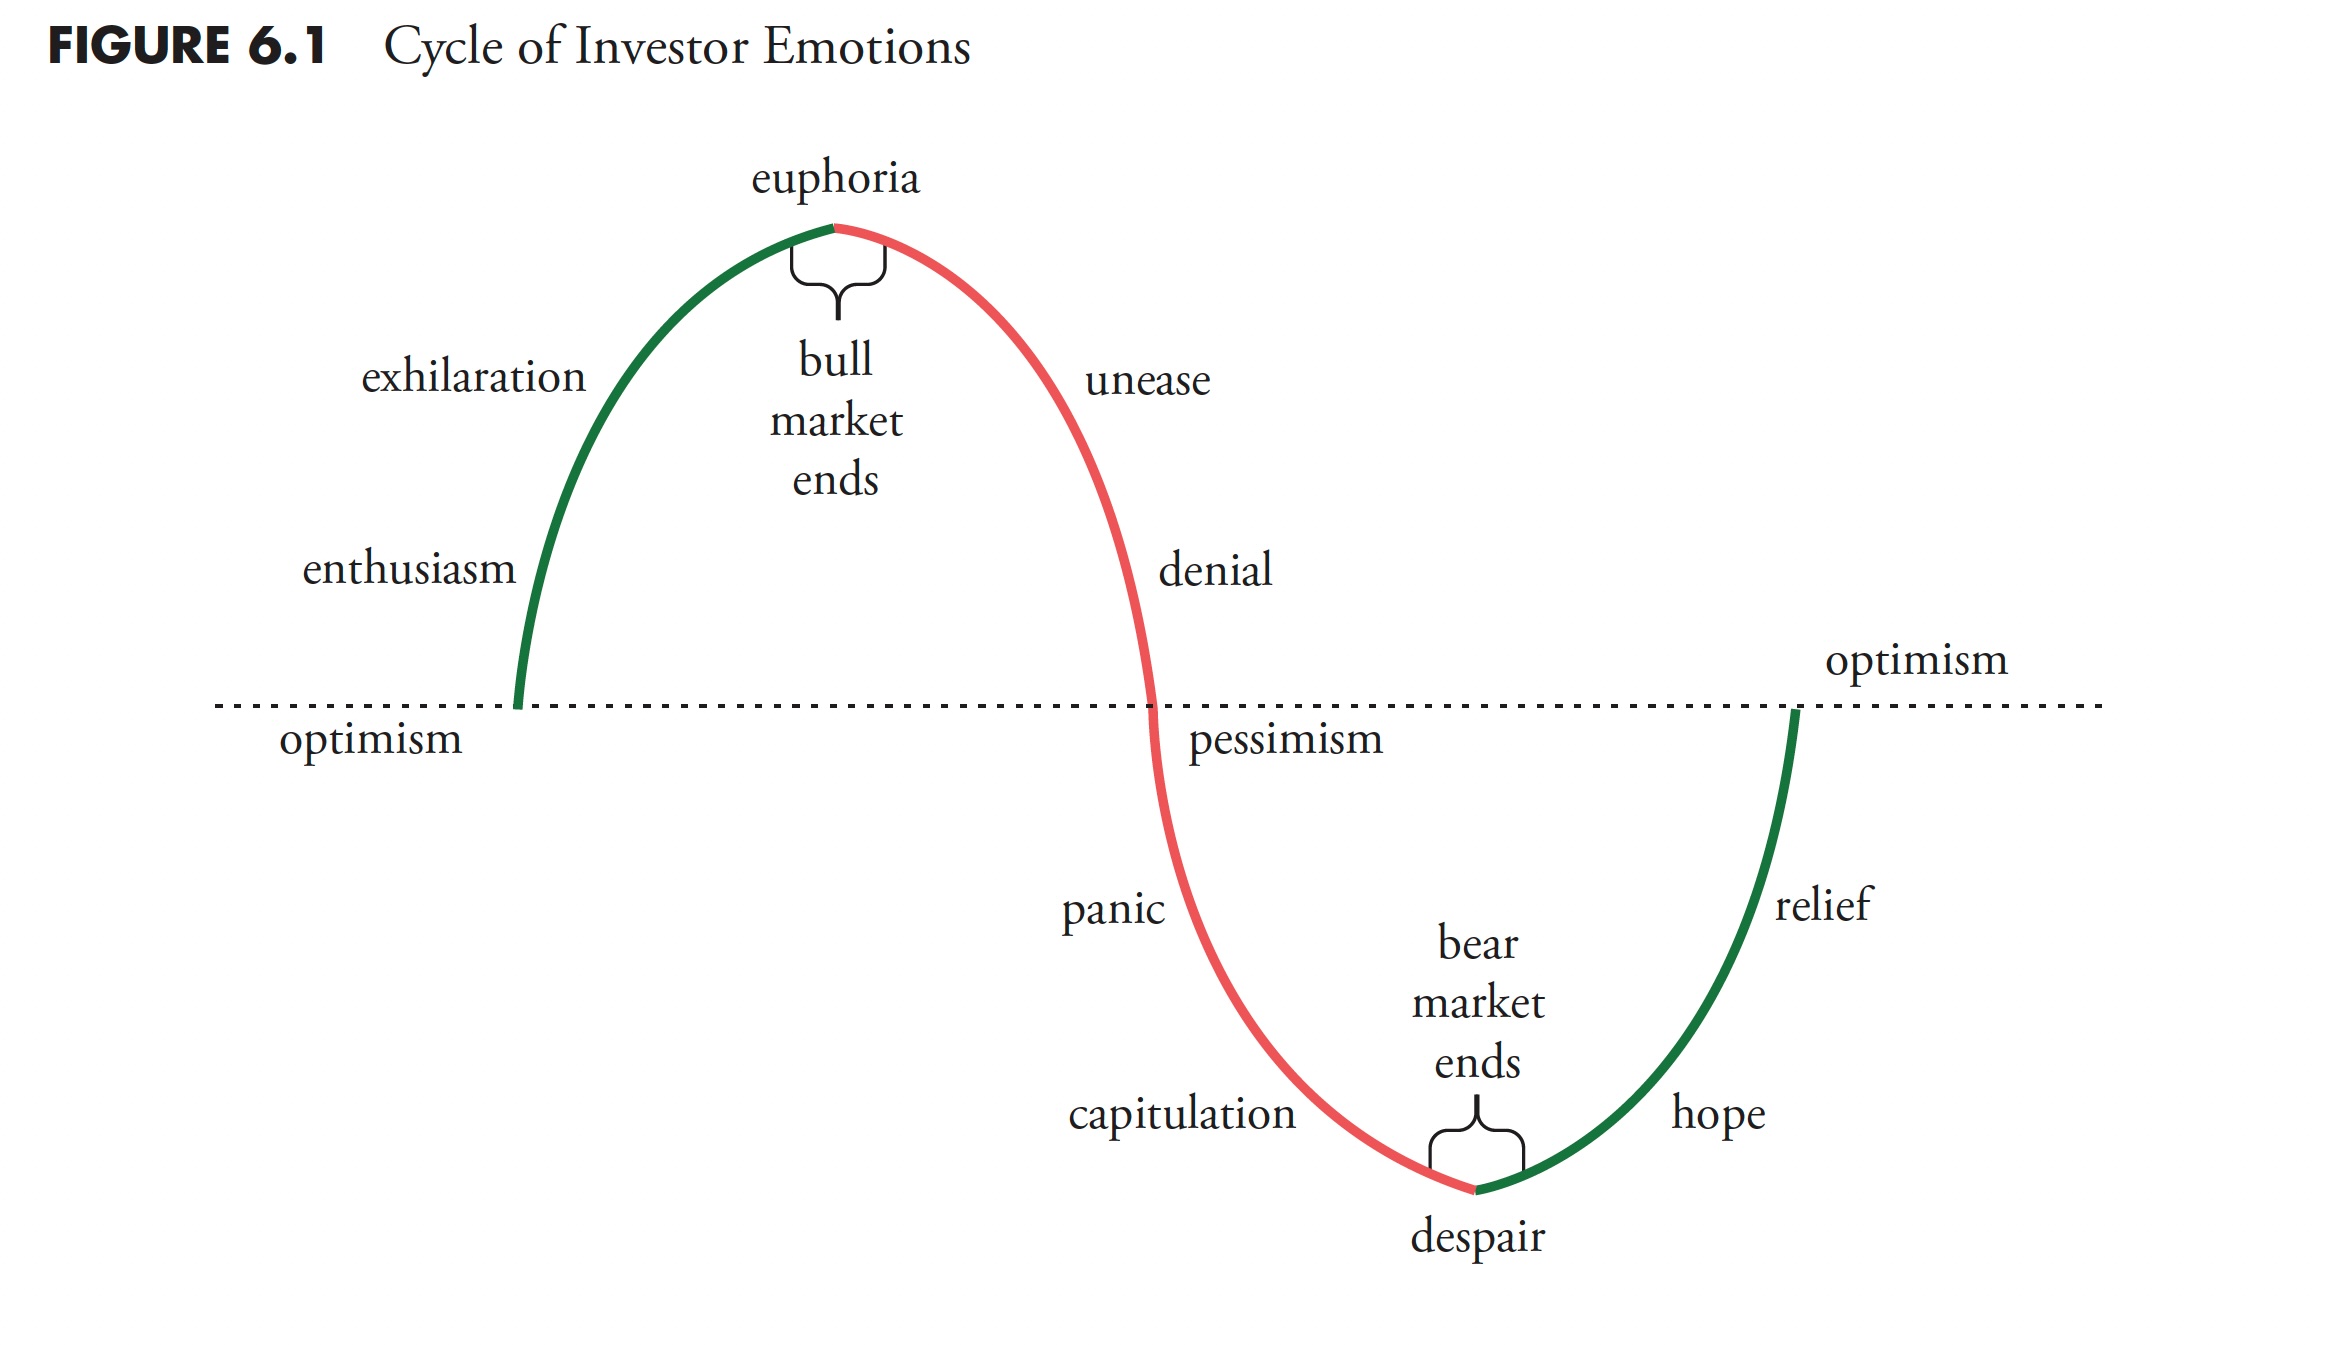
Dancing with the Trend2mo ago
The Hoax of Modern Finance - Part 9: Market Facts — Bull and Bear Markets
Note to the reader: This is the ninth in a series of articles I'm publishing here taken from my book, "Investing with the Trend." Hopefully, you will find this content useful Read More
The Final Bar2mo ago
Markets Bracing for NVDA Earnings
In this edition of StockCharts TV's The Final Bar, Dave breaks down the latest market breadth indicators, ranging from bullish (S&P 500 advance-decline line) to bearish (Bullish Percent Indexes breaking down) to everything in between Read More
Members Only
Martin Pring's Market Roundup2mo ago
Emerging Markets Getting Closer to a Breakout
Last November I asked the question "Are emerging markets about to emerge?" Using the iShares MSCI Emerging Markets ETF (EEM) as our benchmark, I concluded that more strength was needed in order to push the indicators into a bullish mode Read More
Chaikin Analytics2mo ago
The Halftime Show: Don't Box the Invisible Man -- EPS Reports
On this week's edition of StockCharts TV's Halftime, Pete takes a look at long-term trends. Semiconductors taking it on the chin. Inflation is still a problem. Bonds are selling off, and the Fed isn't cutting rates until, in Pete's opinion, the unemployment rate falls Read More
Fill The Gap by CMT Association2mo ago
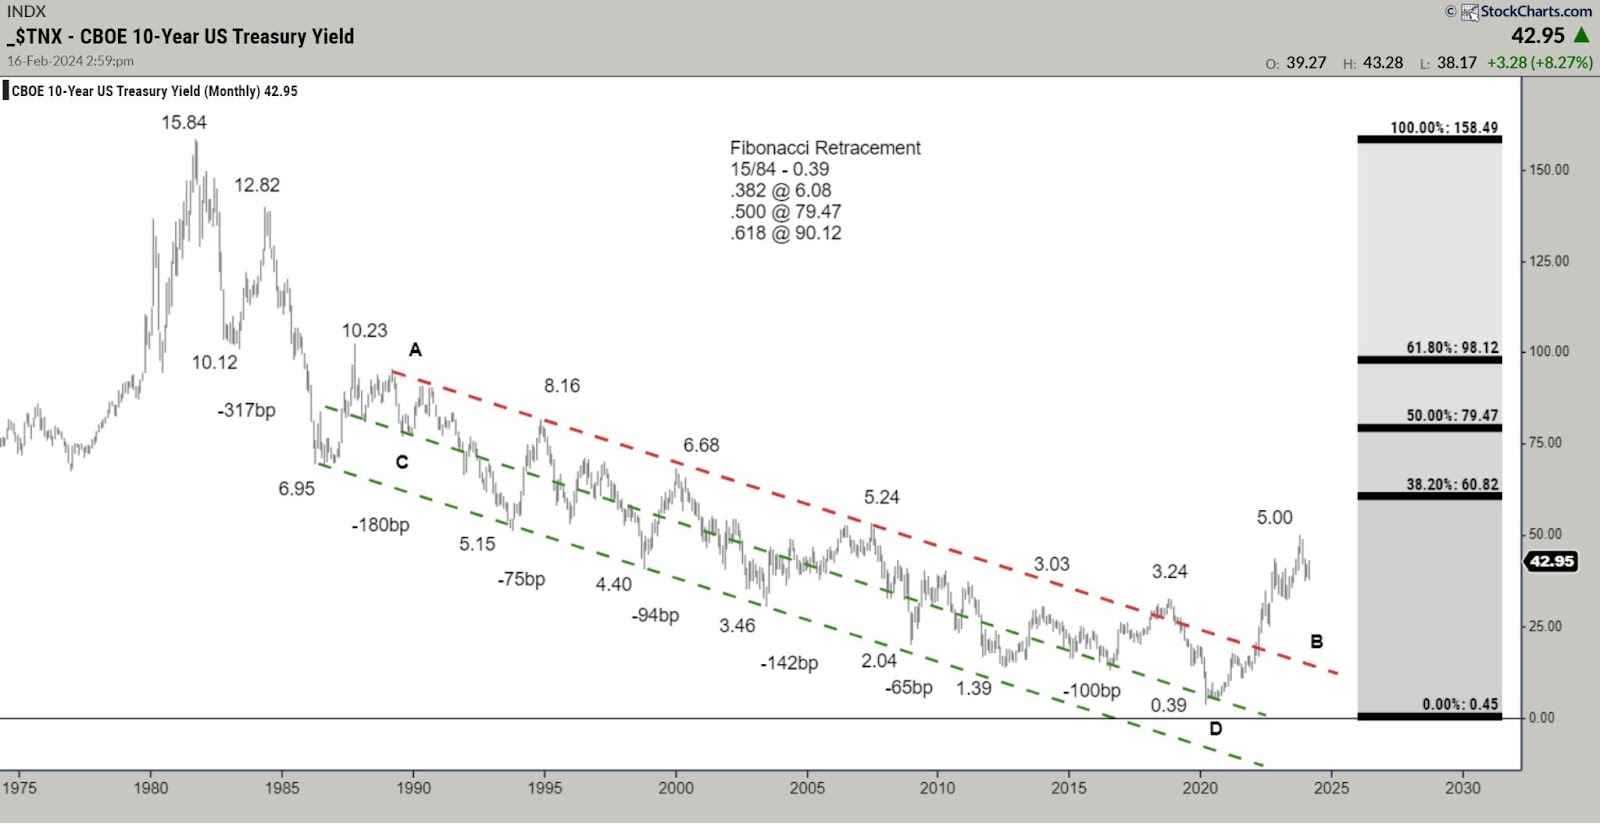
Decoding 10-Year Treasury Yields: A Monthly/Secular Perspective Overview
I begin each year by reviewing the long-term technical positions and behaviors of the "Big Four" — 10-year yields, S&P 500 ($SPX), Commodities, and the US Dollar Read More
The Final Bar2mo ago

The Titanic Syndrome Indicator Issues a WARNING!
In this edition of StockCharts TV's The Final Bar, Dave focuses on AAPL which closed below its 200-day moving average as it tests key price support Read More
RRG Charts2mo ago
Sector Spotlight: Dominant Trend for Stocks Still UP
On this episode of StockCharts TV's Sector Spotlight, I separate the 11 sectors in the S&P 500 into Offensive, Defensive, and Sensitive, assessing their group rotational patterns to see if there is any alignment with the current technical condition of the S&P 500 Read More
RRG Charts2mo ago
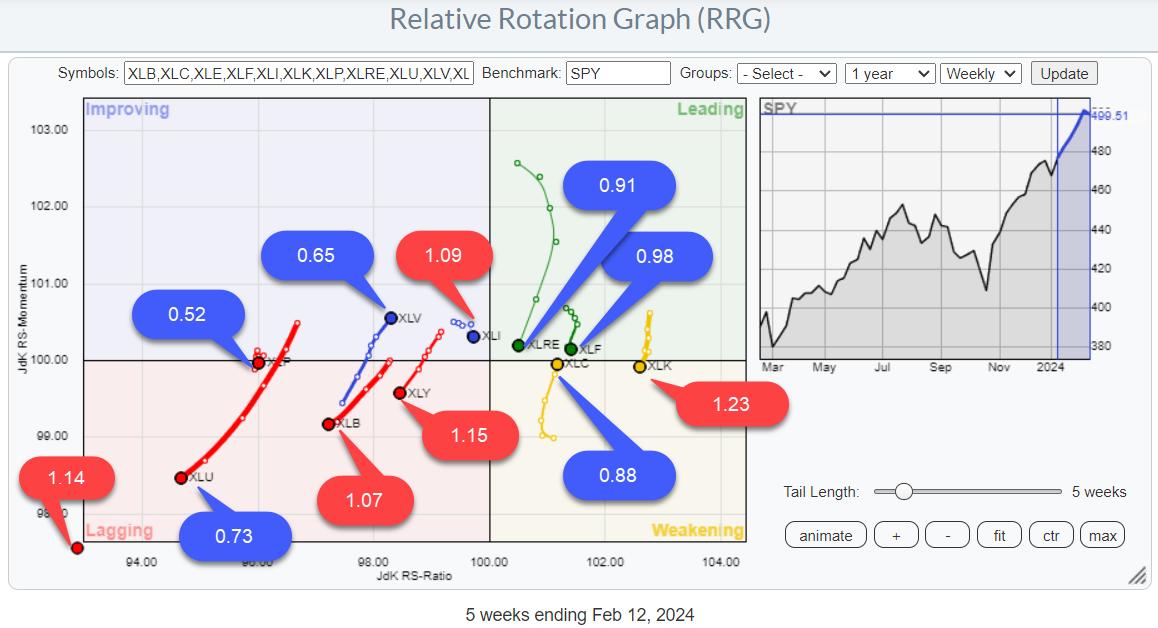
SPY Uptrend Intact, But Mixed Sector Rotation Signals Hesitation
BETA One of the Risk ON/OFF metrics I like to keep an eye on is BETA. From Investopedia: Beta (β) is a measure of the volatility—or systematic risk—of a security or portfolio compared to the market as a whole (usually the S&P 500). Stocks with betas higher than 1 Read More
Trading Places with Tom Bowley2mo ago

With The Top 10 Picks In The Stock Market DRAFT, EarningsBeats.com Selects...
We're one day away from "DRAFT Day"! Every quarter, we select the 10 equal-weighted stocks that will comprise our 3 portfolios - Model, Aggressive, and Income Read More
Art's Charts2mo ago

Capturing the Momentum Phenomenon - Nvidia vs Tesla
The momentum phenomenon has been a fixture in the US equity markets for decades. There are two types of momentum to consider: absolute momentum and relative momentum. Absolute momentum refers to the underlying trend, up or down Read More
Wyckoff Power Charting2mo ago

What Lies Ahead? Will Early 2024 Strength Continue?
A Buying Climax typically concludes a long term uptrend. The rally phase from the October low of 2023 has these climactic characteristics. This advance comes after a major trend that began in late 2022 Read More
Analyzing India2mo ago
Week Ahead: NIFTY Stays In A Defined Range; Expect Directional Moves Only Outside These Levels
Some serious consolidation continued in the markets as the Nifty oscillated in a defined range before closing the week with modest gains Read More
Don't Ignore This Chart!2mo ago
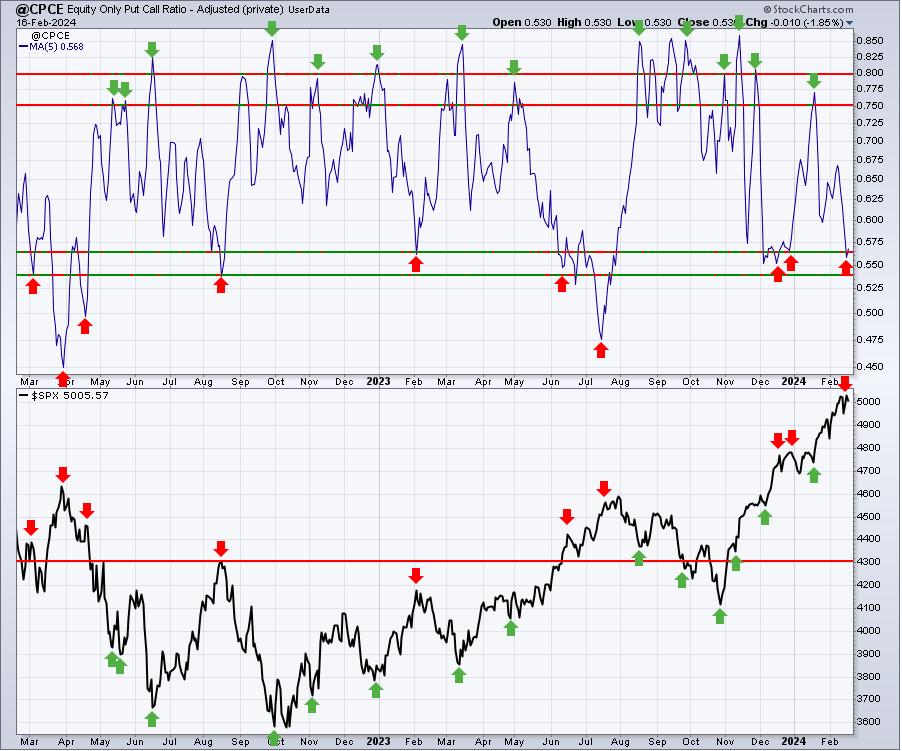
A Very Accurate Sentiment Reading That Is Flashing A RED Light For Bulls
While many analysts follow sentiment signals that involve feelings about market direction, I prefer one that follows the MONEY. I want to know what retail traders are doing with their money with respect to options Read More
Trading Places with Tom Bowley2mo ago

There Remain A Lot Of Mixed Signals, But One Bullish Signal That We Cannot Ignore
The masses have been confounded by the strength of this current secular bull market. Too many keep betting against it and they've cost themselves a huge opportunity for profit as prices have soared Read More
The MEM Edge2mo ago
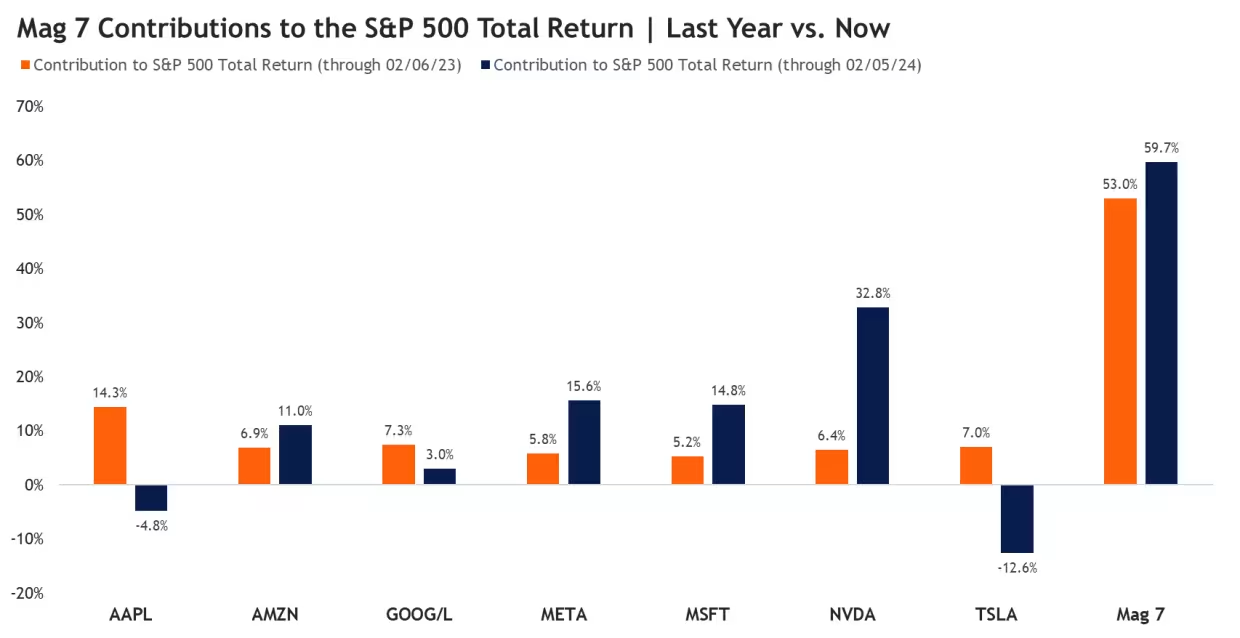
This Beaten-Down Magnificent Seven Stock is Poised to Regain Its Leadership Status
Going into last week, the Magnificent Seven stocks were looking more like the Magnificent Four. Leadership within the group became more concentrated, with Amazon, Meta, Microsoft and Nvidia having done most of the heavy lifting Read More
The Mindful Investor2mo ago
Three Leading Growth Stocks Testing Gap Support
After a remarkably bullish January, which continued the strong market action in November and December, February has had a distinctly different feel Read More
The MEM Edge2mo ago
MEM TV: Risk-On Trades Emerge Amid Big Tech Selloff
In this episode of StockCharts TV's The MEM Edge, Mary Ellen reviews the sloppy week for the markets, driven by the key economic data that was released. We saw interest rates rise, which had some other carry-on impact Read More
The Final Bar2mo ago

What to Do With NVDA (And Others Like It)
In this edition of StockCharts TV's The Final Bar, Dave answers viewer questions on the Money Flow Index, using RSP vs. SPY for relative strength analysis, strategies for names in extended uptrends like NVDA, applying Fibonacci retracements to charts like KRE, and more Read More
StockCharts In Focus2mo ago

Discover the Power of These 2 Cutting-Edge Tools!
It's all about groups on this week's edition of StockCharts TV's StockCharts in Focus! In this video, Grayson shows you how to take your market analysis to the next with level with some of the latest enhancements on the StockCharts platform -- new features added to MarketCarpets Read More
Don't Ignore This Chart!2mo ago

DraftKings' Stock Overheating? Here's What You Need to Do Now
The demand for sports entertainment is constant across each seasonal turn. And for every season, there's a sport in full swing Read More
DecisionPoint2mo ago
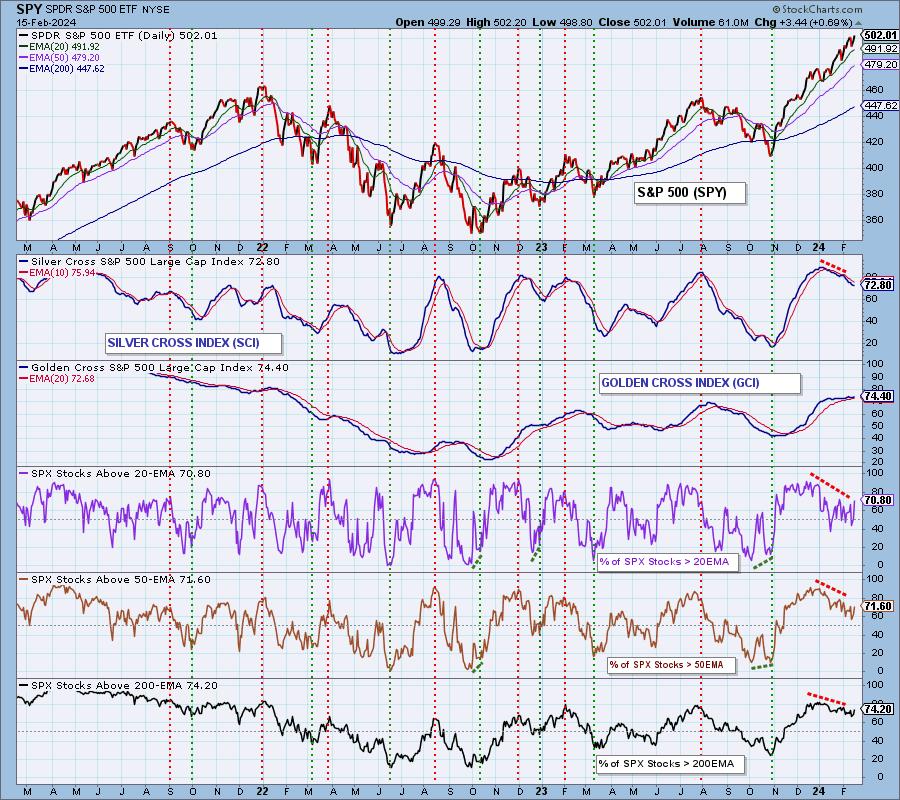
BUY Signals Continue to Diminish
A Golden Cross BUY Signal is generated when the 50-day EMA of a price index crosses up through its 200-day EMA Read More
The Final Bar2mo ago
SMCI Breaks $1,000 Level - What's Next?
In this edition of StockCharts TV's The Final Bar, Bob Lang of Explosive Options shares three charts he's following as the S&P 500 continues to hold the crucial 5,000 level. Host David Keller, CMT highlights key stocks on the earnings list, including DKNG, COIN, and DASH Read More
Stock Talk with Joe Rabil2mo ago
Identifying Powerful Trends with This Game-Changing ADX Setup
On this week's edition of Stock Talk with Joe Rabil, Joe shares the criteria for his favorite ADX setup. He explains what he needs to see on 2 different timeframes to put a stock into position for a powerful trend that can last a long time Read More
Members Only
Larry Williams Focus On Stocks2mo ago
Larry's "Family Gathering" February 15, 2024 Recording
Dancing with the Trend2mo ago
The Hoax of Modern Finance - Part 8: The Enemy in the Mirror
Note to the reader: This is the eighth in a series of articles I'm publishing here taken from my book, "Investing with the Trend." Hopefully, you will find this content useful Read More
Members Only
Martin Pring's Market Roundup2mo ago
Gold is at the Crossroad
Last November and December, it looked as if gold had broken out from a multi-year inverse head-and-shoulders. Since then, the price has dropped below the breakout area, and the long-term KST has begun to roll over Read More
ChartWatchers2mo ago

How To Buy Meta at a Bargain: An Options Strategy You Need to Know
Meta Platforms, Inc. (META) is one of the top S&P 500 performers this year. You probably want to own some shares of it—but not at that $485 price tag Read More
Members Only
Larry Williams Focus On Stocks2mo ago
"Family Gathering" Meeting Today at 2:00 PM Eastern
The Final Bar2mo ago
Market Pullback? Follow These Charts!
In this edition of StockCharts TV's The Final Bar, Dave tracks the S&P 500 back above 5K, Bitcoin back above 50K, and why NFLX, META, & AMZN may be the most important names to follow in the coming weeks Read More
Chaikin Analytics2mo ago

The Halftime Show: Inflation Back in the Driver's Seat
Yesterday, the market saw a massive selloff of over 2% at market lows for the SPY and the NDX. However, the rebound at the end of the day was promising, though not enough to change sentiment Read More
RRG Charts2mo ago
Sector Spotlight: EASY SCAN! Find Growth Names in Small-Caps
On this episode of StockCharts TV's Sector Spotlight, I start with an assessment of the daily and weekly charts for SPY, trying to put recent developments into perspective Read More
Popular Articles
S&P 500 Makes a New All-Time High By End of June?
Here's What You Need To Know About Last Week's Rebound

SPY's Pullback Continues: How To Know When It's Over

S&P 500 & Nasdaq Composite Approach Critical Resistance; Watch for These Important Levels!
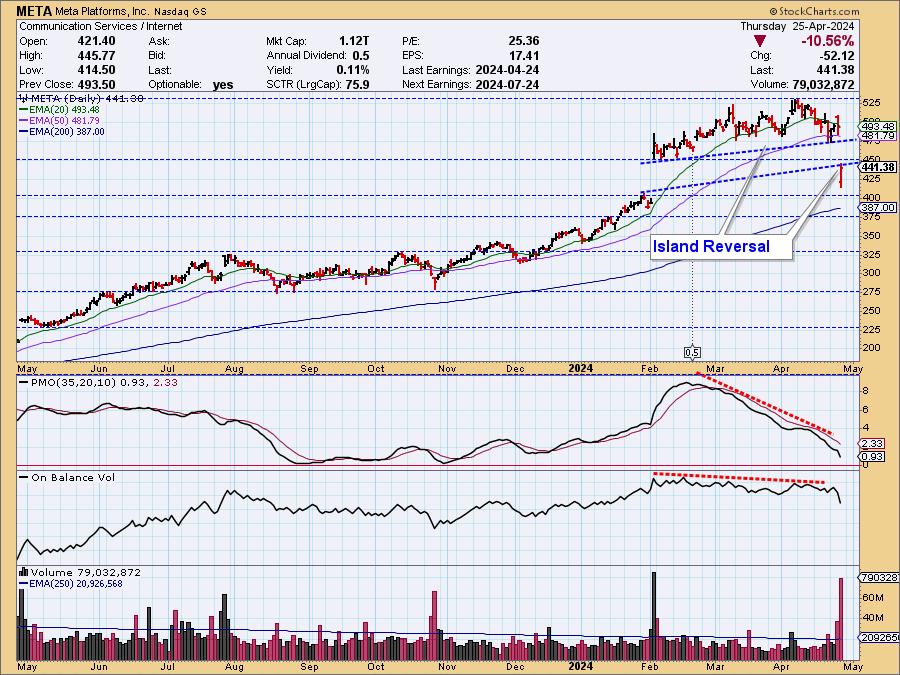
META's Reverse Island - Two More Mag Seven Islands to Monitor

Analyzing Alphabet's Surge — Here's How to Get In Earlier Next Time
Get expert technical commentary delivered straight to your inbox! Sign up for our FREE weekly ChartWatchers Newsletter. Learn More
Featured Authors


Featuring a diverse collection of books, DVDs and more, The StockCharts Store has everything you need to learn more about financial charting, improve your trading systems and become a better investor.
Public ChartList Leaders


StockCharts Members unlock complete access to the Stocks & Commodities Magazine archives. Read the latest articles or browse past editions.