Art's Charts July 29, 2011 at 05:53 AM
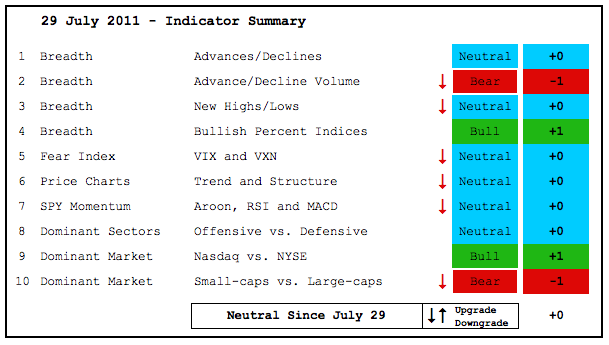
With a slew of downgrades this week, the Indicator Summary now stands at zero, which is a neutral reading. There are several neutral scores this week because many indicator groups are split or on the verge of turning bearish... Read More
Art's Charts July 29, 2011 at 04:39 AM
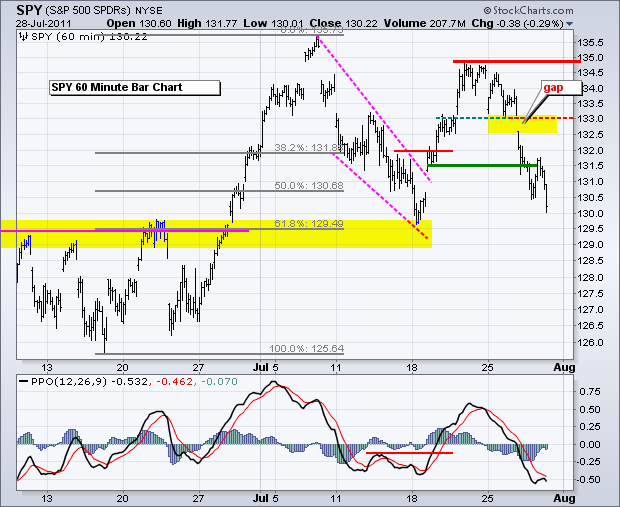
Stocks remained under pressure as early strength gave way to afternoon weakness. QQQ finished with a small gain, but the other major index ETFs finished with small losses. With little real movement on Thursday, nothing has changed on the 60-minute chart... Read More
Art's Charts July 28, 2011 at 07:35 AM
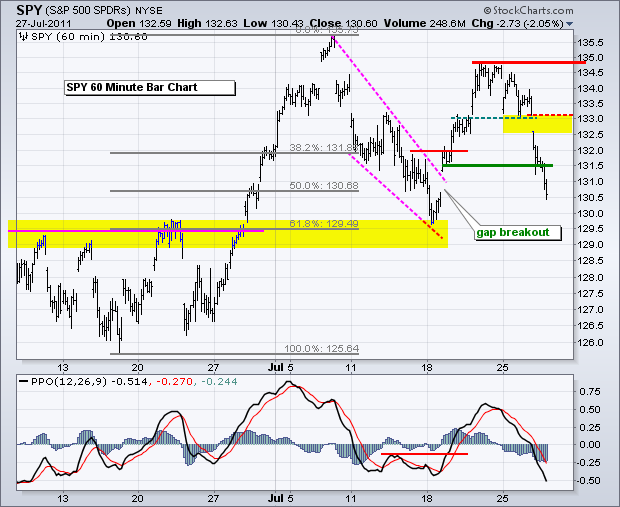
Stocks moved sharply lower with a broad sell off that rocked all boats. All nine sectors were down. Small-caps and mid-caps led the way lower with declines in excess of 2%. Breadth plunged with the NYSE Net Advances Ratio reaching -... Read More
Art's Charts July 28, 2011 at 06:15 AM
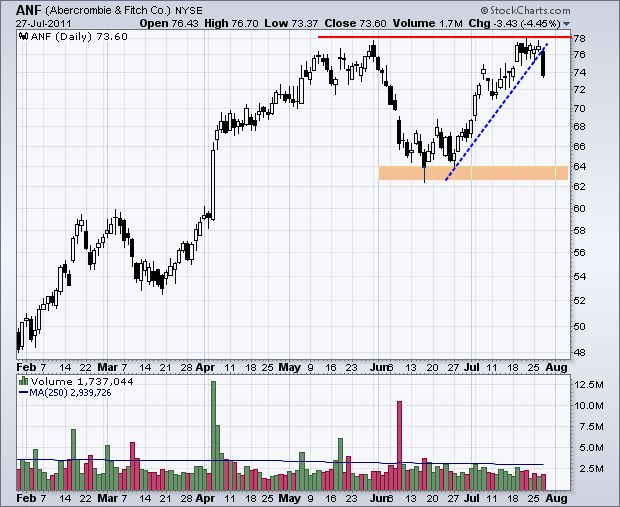
ANF Fails at Resistance with Long Black Candle. DIS Hits Resistance at Broken Support. PLCE Retraces 50% with Rising Wedge. Plus AVP, BBBY and WMT. This commentary and charts-of-interest are designed to stimulate thinking... Read More
Art's Charts July 27, 2011 at 05:10 AM
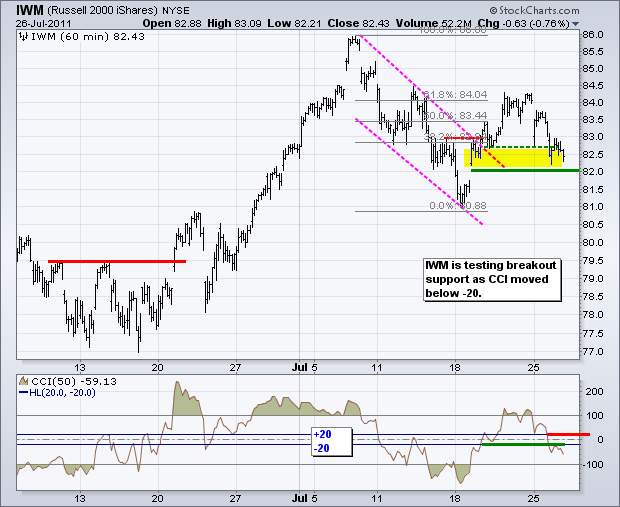
Relative weakness in small-caps remains a concern for the stock market. While the Nasdaq 100 ETF (QQQ) is holding up fine, the Russell 2000 ETF (IWM) is already in its support zone with declines over the last two days. The first chart shows IWM gapping down on Monday... Read More
Art's Charts July 26, 2011 at 05:53 AM
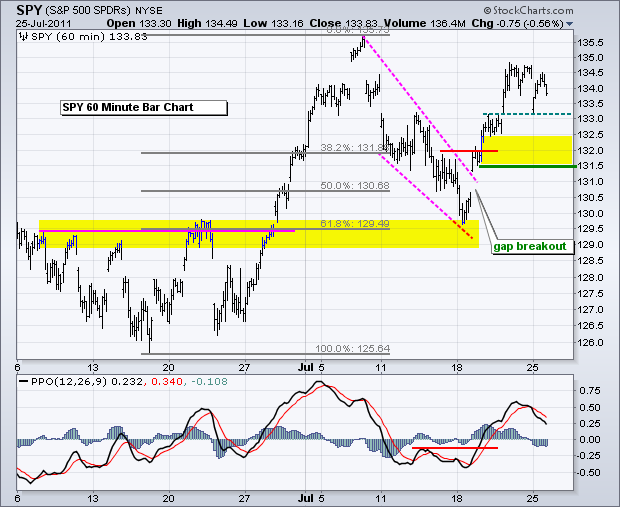
The debt duel in Washington is weighing on stocks, bonds and the Dollar. Techs and QQQ are holding up the best, while small-caps and IWM are faring the worst. This debt duel will soon turn from rumor to news (on or before August 2nd)... Read More
Art's Charts July 26, 2011 at 05:47 AM
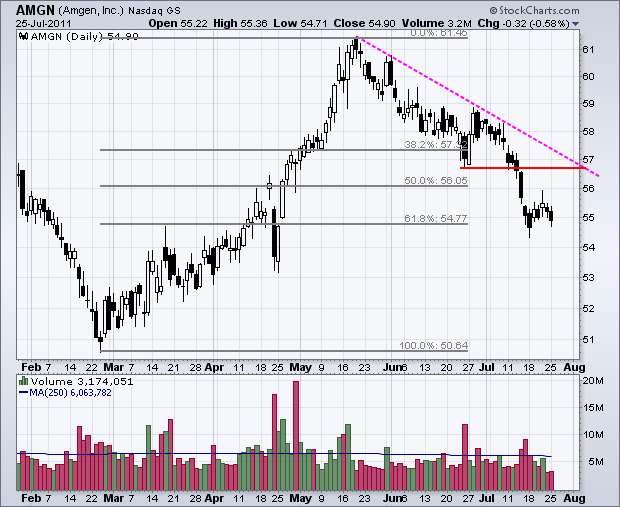
AMGN Hits 61.80% Retracement. EMR Forms Wedge Correction. KEY Challenges Resistance with Volume Surge. Plus AMX, DOW, EMR and SYMC. This commentary and charts-of-interest are designed to stimulate thinking... Read More
Art's Charts July 25, 2011 at 04:24 AM
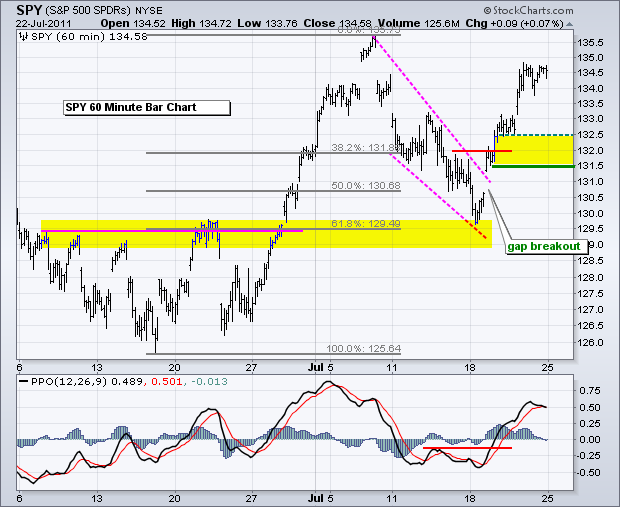
With pre-market stock futures pointing to a sharply lower open, last week's breakouts will get their first test. To recap: the major index ETFs broke channel resistance with gaps and surges on Tuesday. These breakouts held as the gains extended into Friday... Read More
Art's Charts July 22, 2011 at 05:34 AM
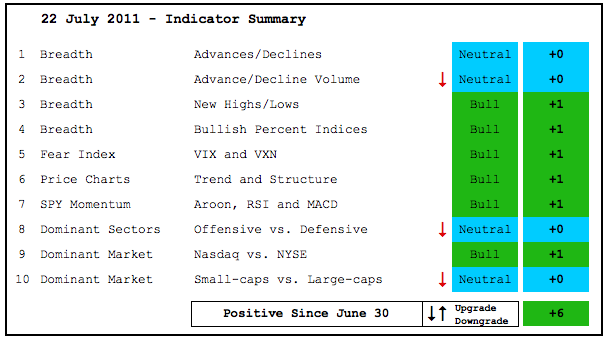
Even though the major index ETFs have yet to break down or show serious weakness, chartists should stay vigilant because the market is not firing on all cylinders right now. There were three downgrades this week, but the indicator summary remains positive overall... Read More
Art's Charts July 22, 2011 at 04:09 AM
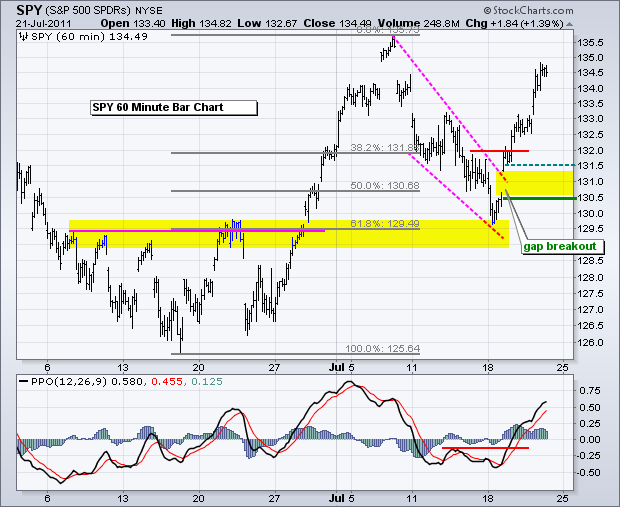
Stocks extended their gains with another broad rally that lifted all sectors. Seven of the nine sectors were up more than 1%. The Finance SPDR (XLF) led the way with a 2.40% gain. On the 60-minute charts, QQQ remains the strongest as it challenges its July (and 2011) highs... Read More
Art's Charts July 21, 2011 at 05:24 AM
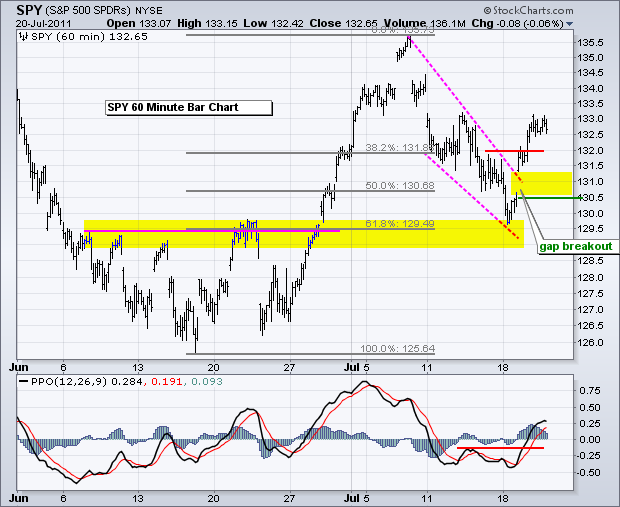
Trading was mixed on Wednesday with the major index ETFs finishing slightly negative. This looks like a little buy-the-rumor and sell-the-news, especially for Apple, which opened above 396 and closed below 387... Read More
Art's Charts July 21, 2011 at 05:13 AM
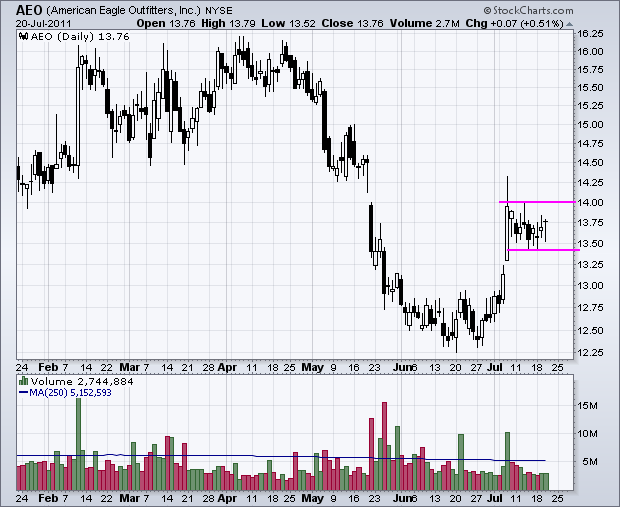
AEO Consolidates after Surge. DANG Forms Hammer Near June Lows. STJ Traces out High Volume Bullish Engulfing. Plus IP, SVU, WFT This commentary and charts-of-interest are designed to stimulate thinking... Read More
Art's Charts July 20, 2011 at 05:16 AM
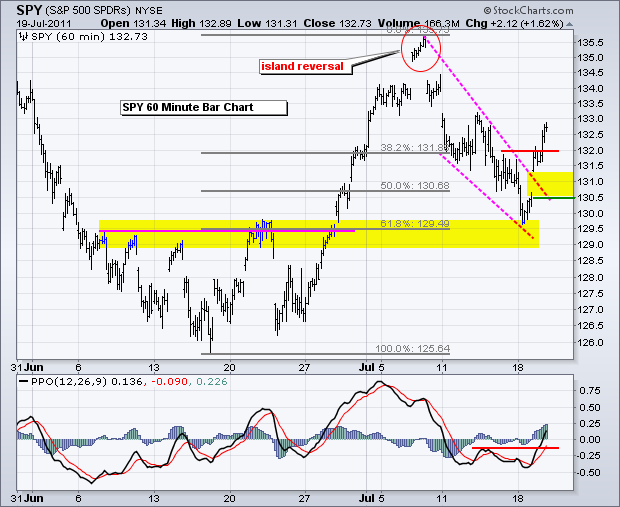
Led by the technology and consumer discretionary sectors, stocks surged on Tuesday and the major index ETFs broke channel resistance. All nine sectors were up with seven of nine up more than 1%... Read More
Art's Charts July 19, 2011 at 06:06 AM
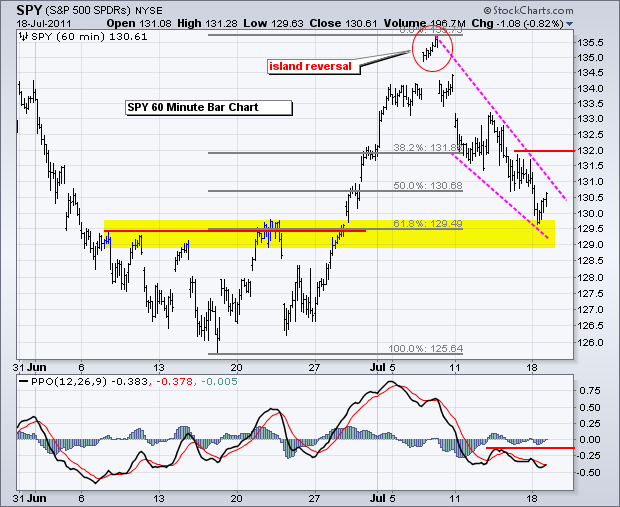
After a big surge from mid June to early July, stocks corrected with pullbacks over the last seven trading days. SPY and IWM were weighed down by weakness in money-center banks and regional banks on Monday, but DIA and QQQ held up relatively well... Read More
Art's Charts July 19, 2011 at 06:03 AM
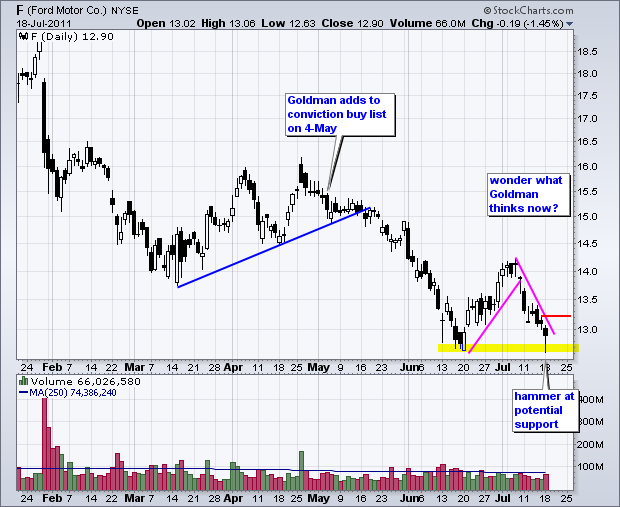
F Forms Hammer Near Prior Low. JPM Establishes Clear Resistance Hurdle. SD Surges on Good Volume. Plus MOS and MRVL. This commentary and charts-of-interest are designed to stimulate thinking... Read More
Art's Charts July 18, 2011 at 09:02 AM
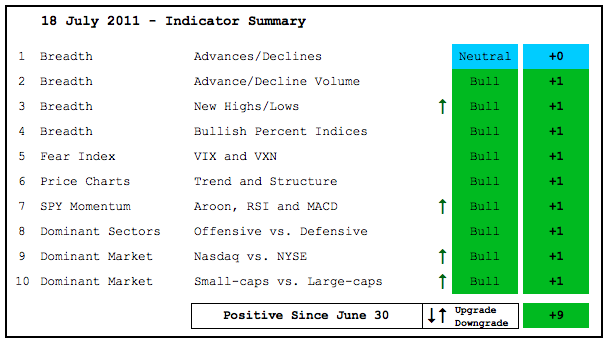
With several more upgrades, the indicator summary moved from +2 to +9 over the last two weeks. Nine of the ten indicator groups are positive or bullish. The AD Lines remain neutral because of a split decision... Read More
Art's Charts July 18, 2011 at 07:12 AM
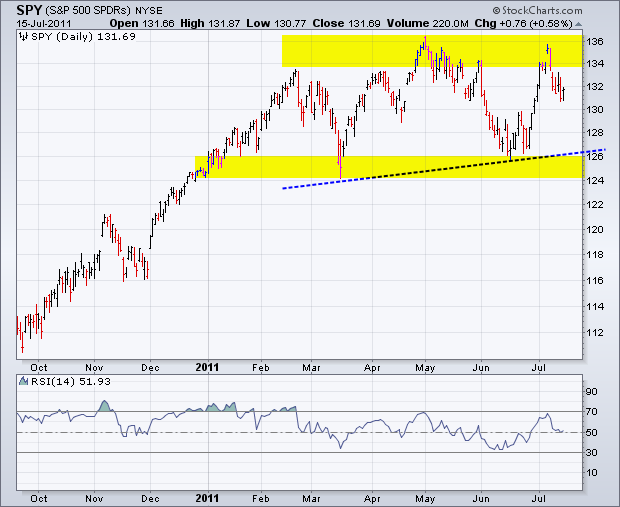
The decline in stocks over the last six days looks like a correction after a sharp advance. The major index ETFs moved sharply higher from mid June to early July. From the June 15th low to the July 7th high, SPY was up over 6%, while QQQ and IWM were up around 9%... Read More