Art's Charts August 31, 2011 at 05:59 AM
The bulls held up well in the face of a bad consumer confidence report. August consumer confidence hit a two year low. Even though consumer confidence is a lagging indicator, there are fears that this could put pressure on consumer spending... Read More
Art's Charts August 30, 2011 at 07:31 AM
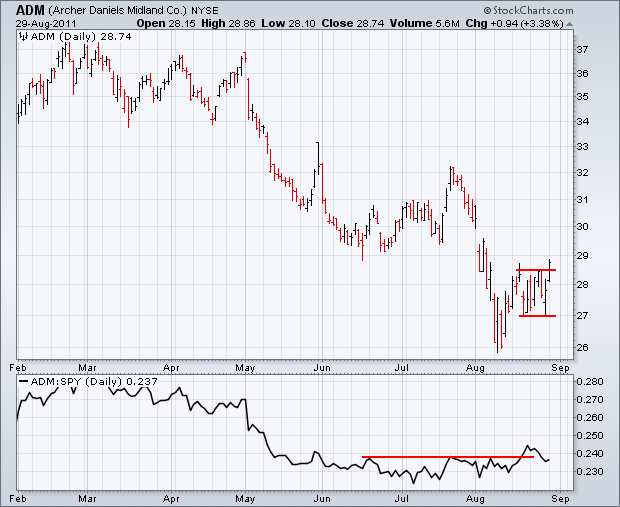
ADM Bounces Along with Grains. ALL Surges on Big Volume. PEP Breaks Triangle Trendline. Plus AMX, CMCSA, NE This commentary and charts-of-interest are designed to stimulate thinking... Read More
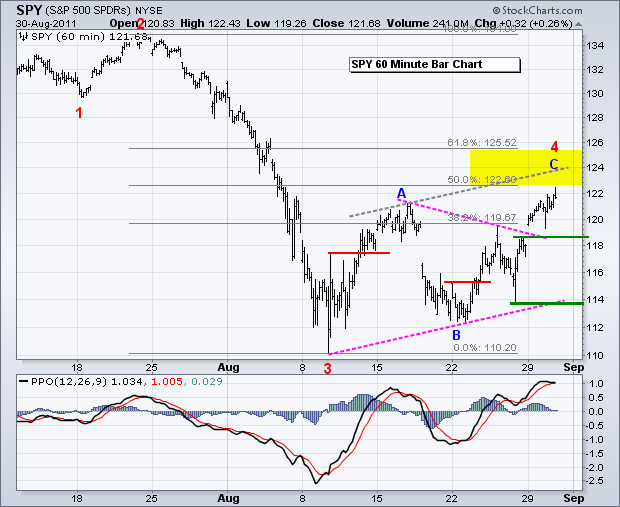
Art's Charts August 30, 2011 at 06:43 AM
Stocks continued higher on Monday with another all or nothing day. Net Advancing Volume for the NYSE and Nasdaq hit +94% and +93%, respectively. All major index ETFs were sharply higher with small-caps and mid-caps leading the way... Read More
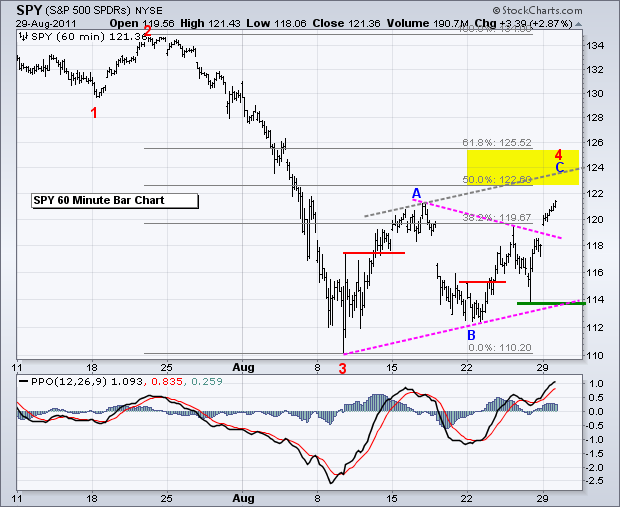
Art's Charts August 29, 2011 at 05:40 AM
Stocks started weak ahead of Bernanke's speech, but rallied afterwards and closed relatively strong. Bernanke did not offer a QE3 and the speech produced little drama, which is just what the bulls needed. In fact, the reversal from 10AM to 12PM was quite strong... Read More
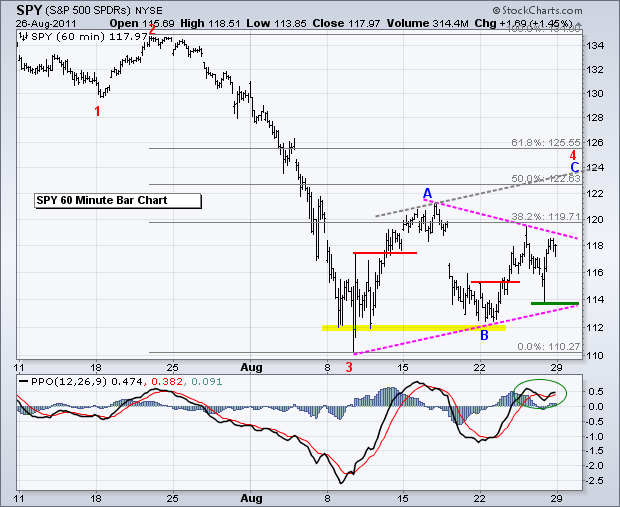
Art's Charts August 26, 2011 at 06:19 AM
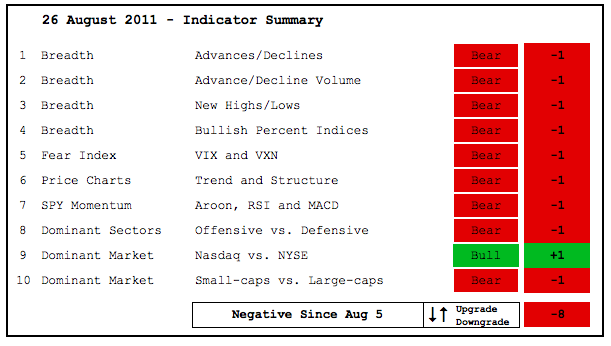
There is no change in the indicator summary as the major index ETFs consolidate after their big breakdowns. New lows continue to outpace new highs. The volatility indices remain at high levels, which reflects a great amount of fear in the market place... Read More
Art's Charts August 26, 2011 at 04:47 AM
Stocks opened strong on the heels of Warren Buffet's $5 billion investment in Bank of America (BAC). However, stocks did not finish strong. Neither did BAC or the other big banks. Selling pressure took hold after this strong open and stocks closed down... Read More
Art's Charts August 25, 2011 at 06:00 AM
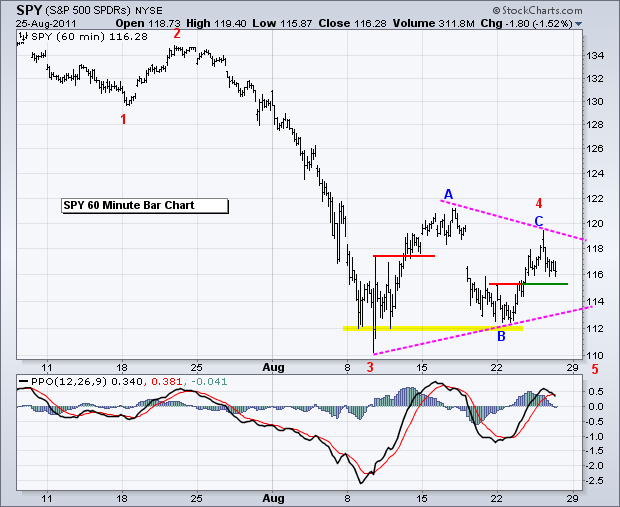
A late rally saved the day for the bulls as the major index ETFs closed strong. The S&P 500 ETF (SPY) and Russell 2000 ETF (IWM) led the way higher with gains around 1.5%. The Nasdaq 100 ETF (QQQ) lagged with a gain that was less than 1%... Read More
Art's Charts August 25, 2011 at 05:56 AM
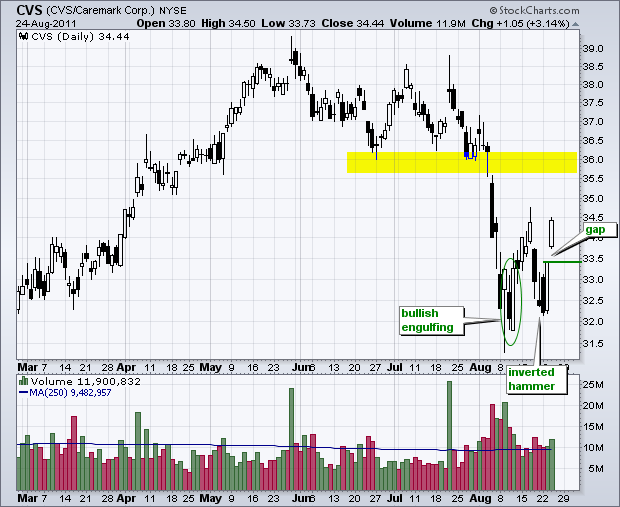
GLW Forms Small Wedge After Surge. MRVL Forges One Day Island Reversal. YHOO Consolidates After Mid August Surge. Plus CVS, FNSR, TAP, WFR This commentary and charts-of-interest are designed to stimulate thinking... Read More
Art's Charts August 24, 2011 at 05:26 AM
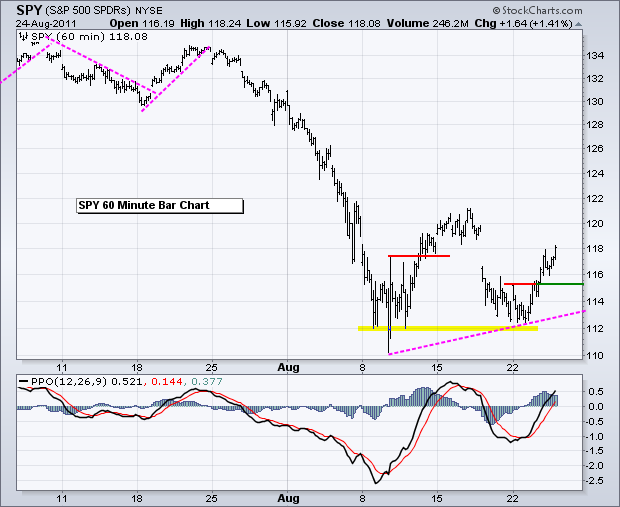
Stocks moved sharply higher on Tuesday with the major index ETFs gaining 3% or more. All sectors were up with energy and consumer discretionary leading the way. Wednesday's move was certainly broad based, but still considered an oversold bounce with a larger downtrend... Read More
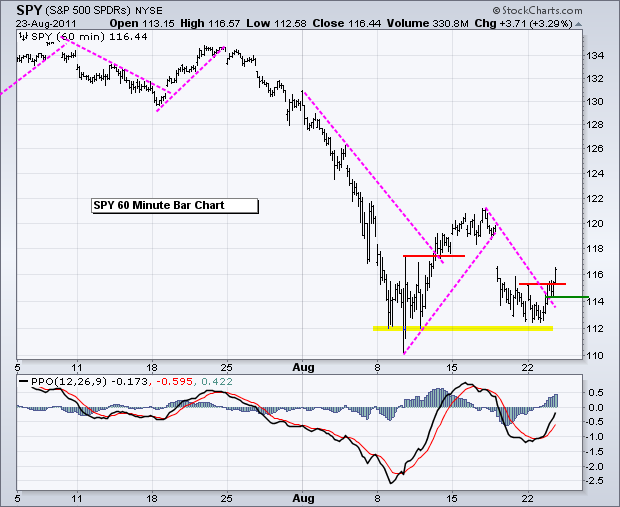
Art's Charts August 23, 2011 at 06:02 AM
It was pop and drop on Monday. Stocks opened strong, but gains quickly evaporated as selling pressure took over... Read More
Art's Charts August 23, 2011 at 05:58 AM
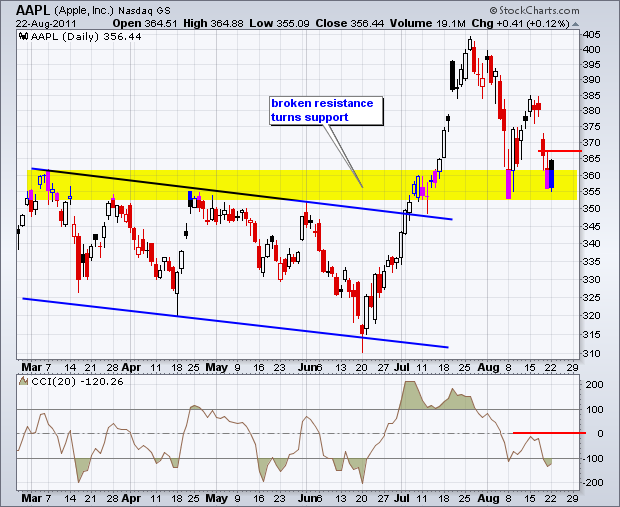
AAPL Returns to Broken Resistance. BIIB Firms in 50-61.80% Retracement Zone. DE Forms Gravestone Doji above Early August Low. Plus ATVI, ERTS, MCP This commentary and charts-of-interest are designed to stimulate thinking... Read More
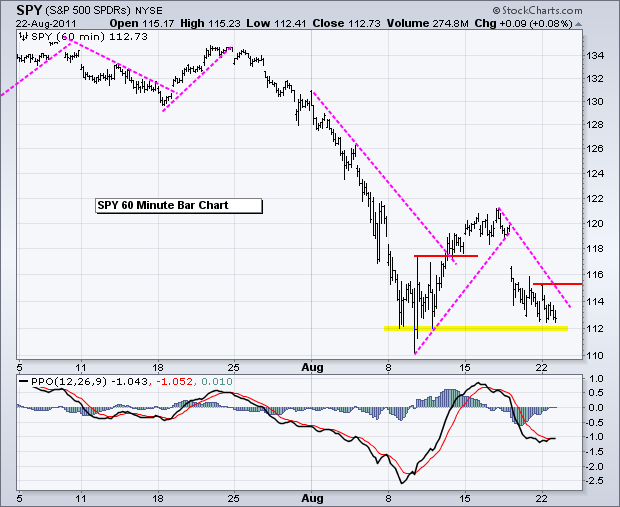
Art's Charts August 22, 2011 at 06:16 AM
Bottom-pickers and knife-catchers are no doubt eyeing current levels as the major index ETFs tests the early August lows. After a sharp decline the first week of August, trading turned very volatile with four consecutive 4+ percent swings in SPY (down,up,down,up)... Read More
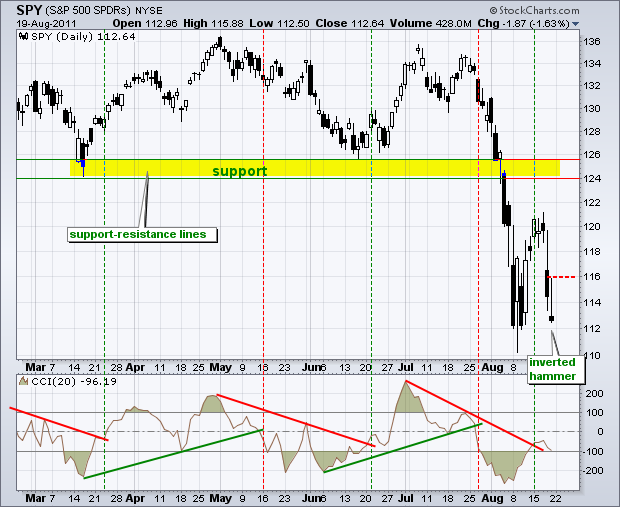
Art's Charts August 19, 2011 at 06:01 AM
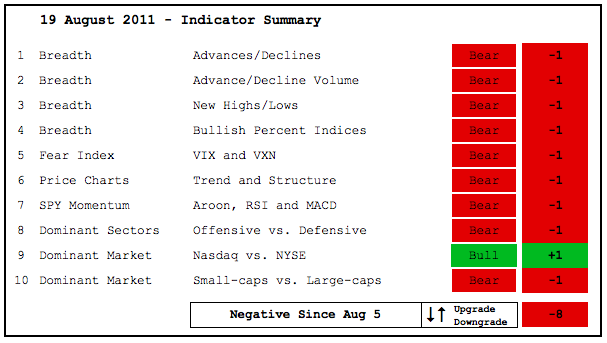
The indicator summary remains decidedly negative and is unlikely to turn positive anytime soon. After some serious technical damage the last few weeks, the bulls need time to regroup and form some sort of base... Read More
Art's Charts August 19, 2011 at 04:34 AM
Selling pressure hit the stock market hard on Thursday as the major index ETFs declined sharply. Small-caps and mid-caps led the way lower as their respective indices declined over 5%. All sectors were lower... Read More
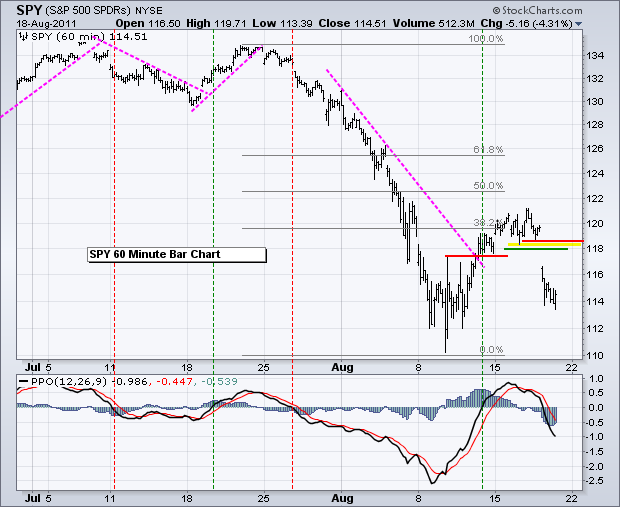
Art's Charts August 18, 2011 at 05:28 AM
The 38.2% retracements are marking resistance as the major index ETFs stutter this week. From low to high, the S&P 500 ETF (SPY) surged from 110 to 121 over the past week. Most of this move came with Thursday's surge from 113 to 119... Read More
Art's Charts August 18, 2011 at 05:22 AM
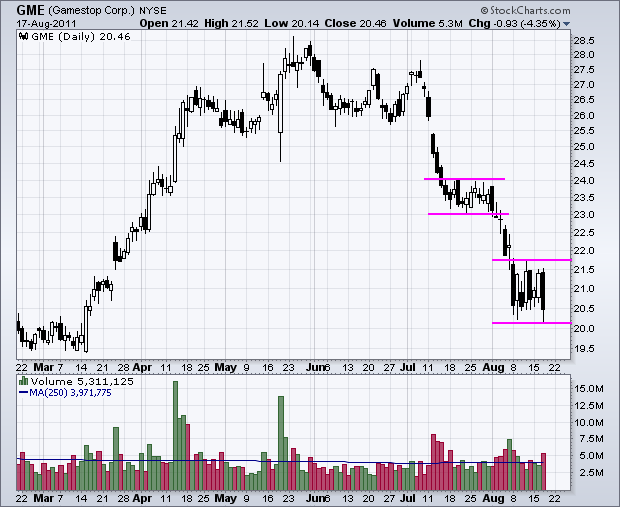
GME Traces out Flag within Downtrend. GR Forms Hanging Man. TIN Bounces to Key Retracement. Plus HUM, LXK, VSI This commentary and charts-of-interest are designed to stimulate thinking... Read More
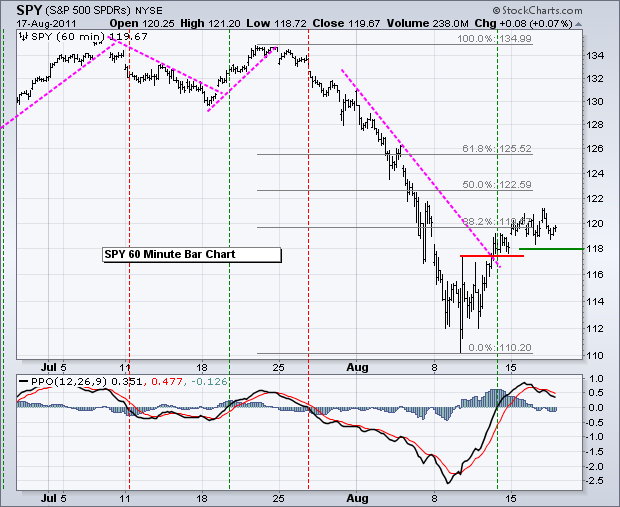
Art's Charts August 17, 2011 at 05:45 AM
Stocks are caught between a rock (medium-term downtrend) and a hard place (short-term uptrend). After a good bounce the last few days, stocks took a breather with some weakness on Tuesday. Actually, stocks have been trading flat since Monday's gap up... Read More
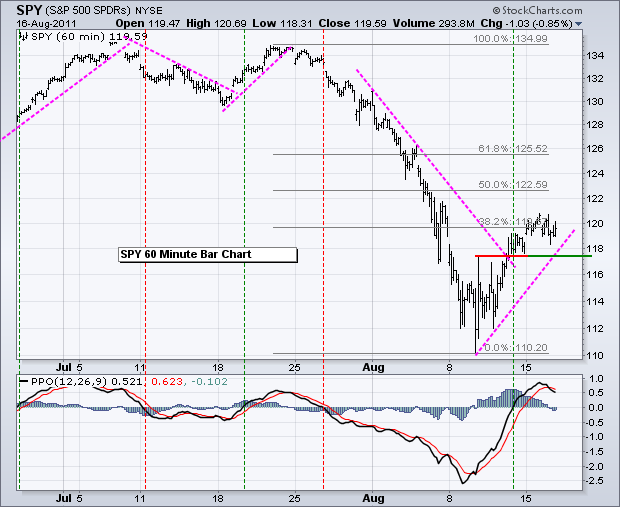
Art's Charts August 16, 2011 at 07:10 AM
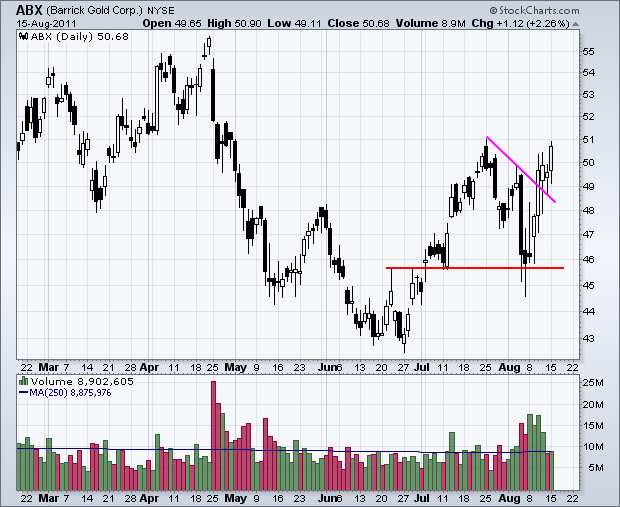
Charts of Interest: ABX, ANF, BBBY, NEM, RAX This commentary and charts-of-interest are designed to stimulate thinking. This analysis is not a recommendation to buy, sell, hold or sell short any security (stock ETF or otherwise)... Read More
Art's Charts August 16, 2011 at 06:21 AM
Stocks extended their gains on Monday with strong breadth. All sectors were up 1.4% or more. The Energy, Finance and Utilities SPDRs surged over 3%. NYSE Net Advances Percent hit 81% and Nasdaq Net Advances Percent finished at 61%. The NYSE number was especially strong... Read More
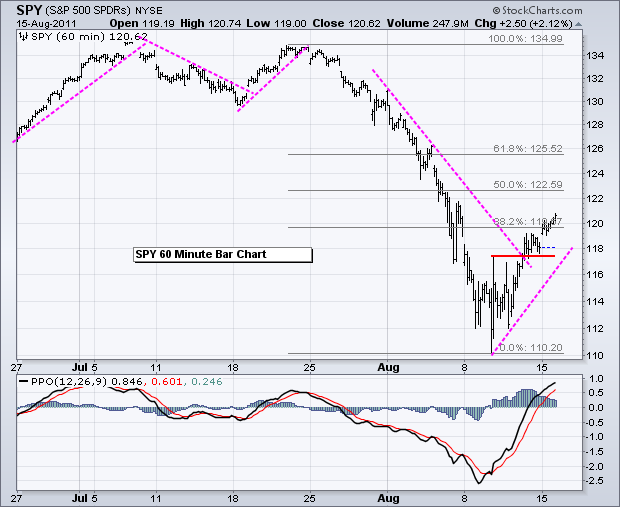
Art's Charts August 14, 2011 at 09:03 AM
The major index ETFs are now in short-term uptrends as they bounce from oversold levels. SPY tested 112 on Monday and Wednesday with an intraday dip to 110.5 in between (Tuesday)... Read More
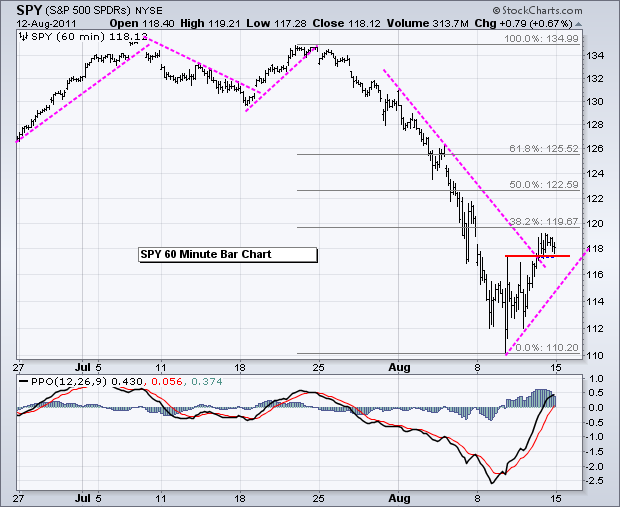
Art's Charts August 12, 2011 at 02:16 AM
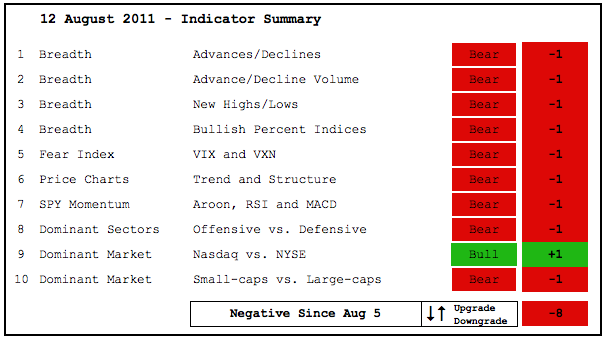
The indicator summary remains unchanged after a topsy-turvy week. Nine of the ten indicators are clearly in bear mode. The Nasdaq/NY Composite ratio is the only indicator considered positive because the Nasdaq is outperforming the NY Composite... Read More
Art's Charts August 11, 2011 at 08:10 AM
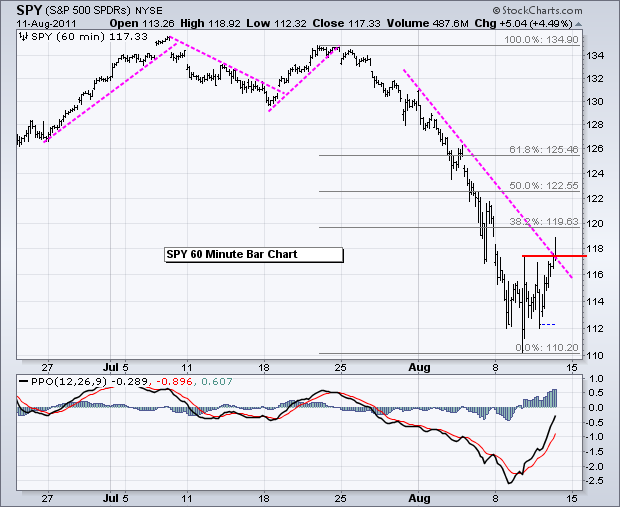
The stock market staged another big advance in the face of adversity. This is the second such advance in the last three days. All the same, the major index ETFs remain below their closing levels from last Friday. In other words, stocks are still down for the week... Read More
Art's Charts August 11, 2011 at 08:10 AM
The stock market staged another big advance in the face of adversity. This is the second such advance in the last three days. All the same, the major index ETFs remain below their closing levels from last Friday. In other words, stocks are still down for the week... Read More
Art's Charts August 11, 2011 at 01:53 AM
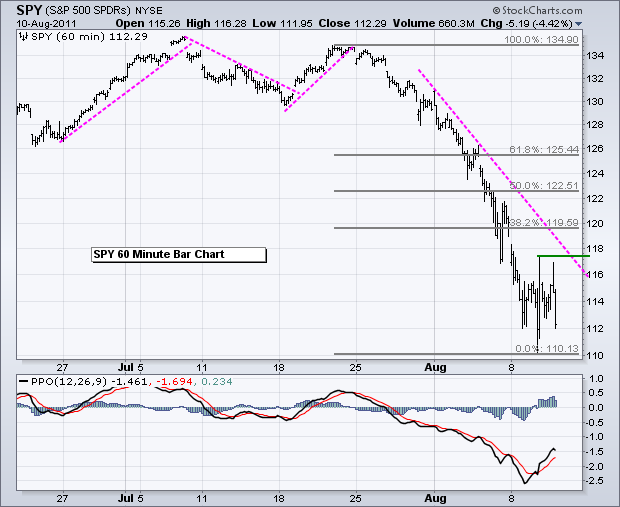
Stocks continued their wild ride with a decline that gave back Tuesday's gains. Even so, the major index ETFs remained above Tuesday's lows. In other words, Wednesday's decline is perhaps a test of the lows... Read More
Art's Charts August 10, 2011 at 02:06 AM
In the FOMC policy statement, Bernanke signaled that the Fed is prepared to leave interest rates near zero until at least mid 2013. Say what? Bernanke must have one heck of a crystal ball to forecast interest rates so far in advance... Read More
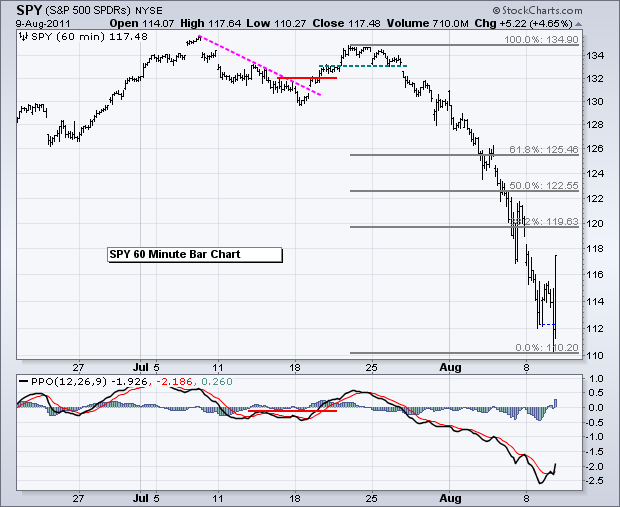
Art's Charts August 09, 2011 at 12:54 PM
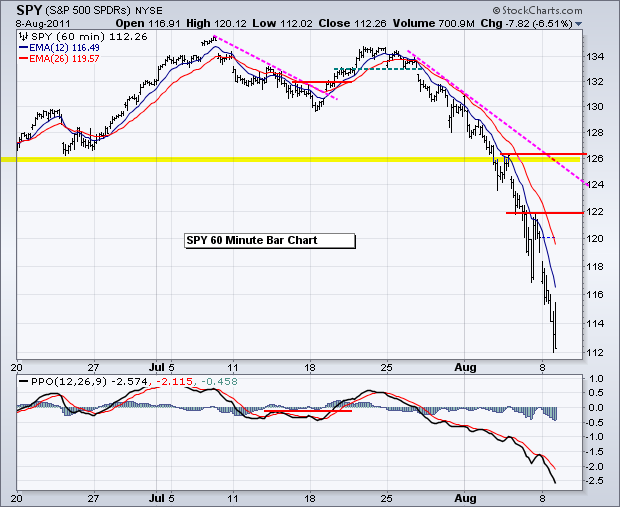
Stocks opened weak, remained weak and closed weak. The short-term and medium-term trends are clearly down at this point, but the current trends are way oversold after the sharp decline of the last two weeks... Read More
Art's Charts August 08, 2011 at 02:23 AM
As of this writing, the markets are in panic after Standard and Poor's downgraded US debt late Friday. Stocks, bonds and oil are down sharply overnight. Dow futures were down around 274 points at 2AM ET. The Dollar is also down, but the losses are relatively modest... Read More
Art's Charts August 05, 2011 at 06:04 AM
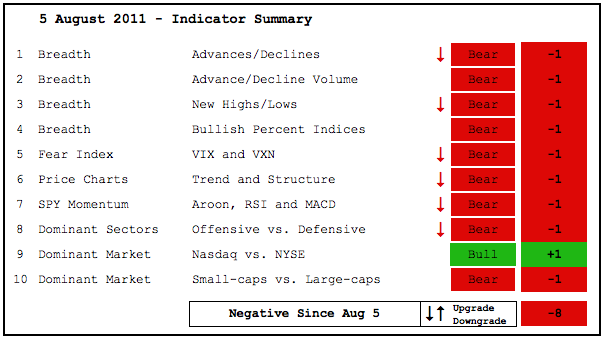
Unsurprisingly, there were several downgrades this week as sharp declines did lots of technical damage. Last week I noted that many indicators were on the verge of turning bearish. Some turned bearish after the close on Friday and the rest followed on Tuesday... Read More
Art's Charts August 05, 2011 at 03:38 AM
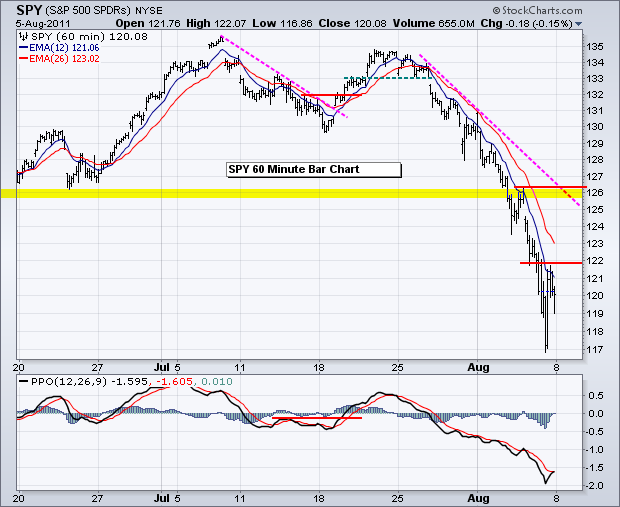
With another big move in stocks and bonds, the underlying trends have accelerated even further to become more extended. The only thing we can do at this point is respect the trend. The downtrend is too strong to justify longs and too oversold to justify new shorts... Read More
Art's Charts August 04, 2011 at 05:26 AM
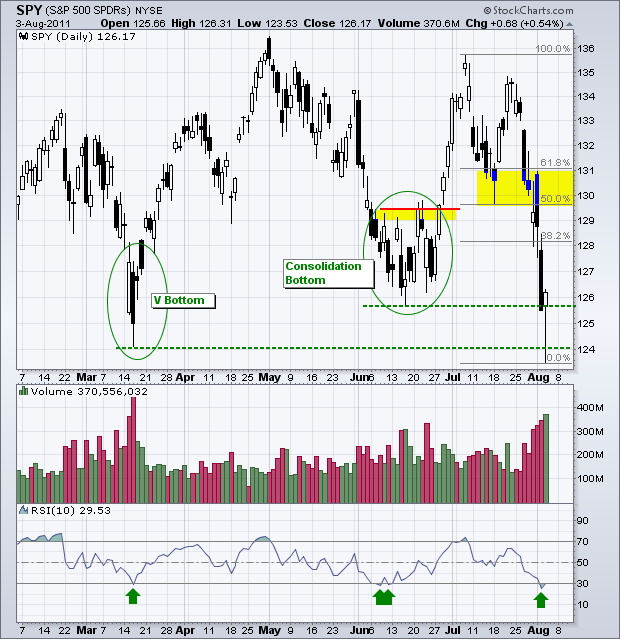
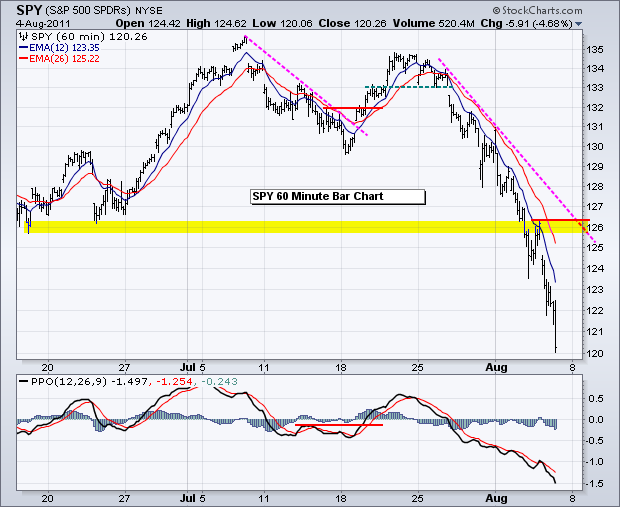
After becoming oversold on Tuesday, the major index ETFs formed high-volume hammers on Wednesday. Today's report will feature daily charts to get some perspective. SPY dipped below 124 and below its March low, but recovered to close above 126... Read More
Art's Charts August 04, 2011 at 05:21 AM
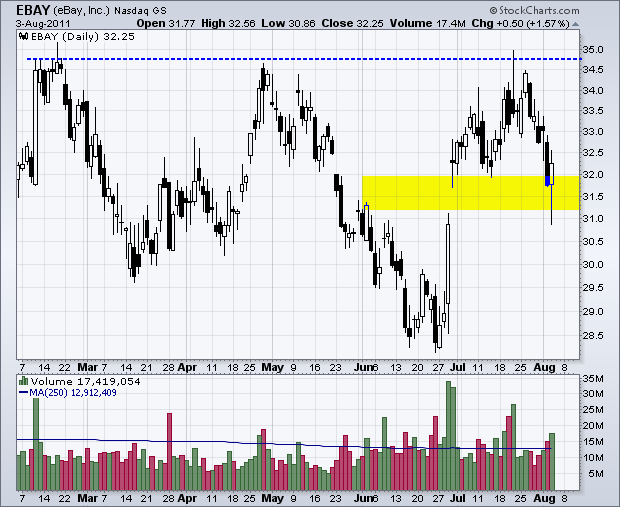
EBAY Firms in Gap Zone. LSI Breaks Pennant Resistance. ORCL Tests Support with Inverted Hammer. Plus SIR, T and VZ. This commentary and charts-of-interest are designed to stimulate thinking... Read More
Art's Charts August 03, 2011 at 04:02 AM

Stocks are now very oversold with some long-term support levels coming into play. Over the last seven trading days, IWM is down 8.69%, SPY is down 6.75% and QQQ is down 5.59%. 10-day RSI moved below 30 for SPY and IWM, but remains above 30 for QQQ... Read More
Art's Charts August 02, 2011 at 03:29 AM
Trading turned quite volatile on Monday as stocks opened sharply higher, moved sharply lower and then recovered somewhat. Despite all this pushing and shoving, the major index ETFs closed slightly lower and all sector SPDRs were down for the day... Read More
Art's Charts August 02, 2011 at 03:25 AM
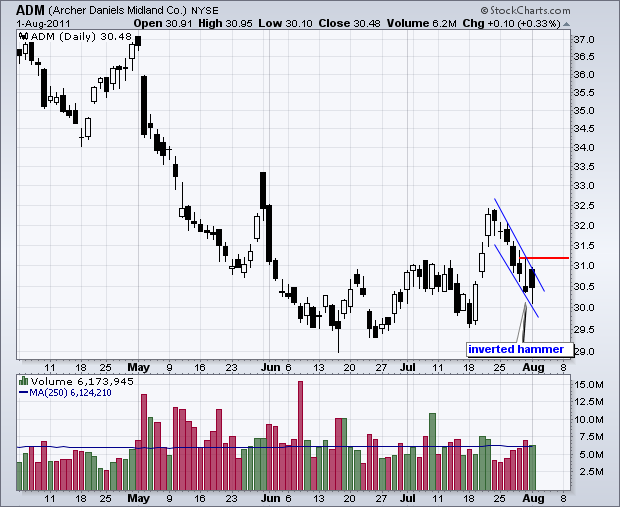
ADM Forms Inverted Hammer within Steep Flag. DOW Bucks the Trend with Small Gain. FITB Forms Bull Flag... Read More
Art's Charts August 01, 2011 at 05:48 AM
Unsurprisingly, Congress and the White House struck an 11th hour deal on the debt ceiling. Stock futures are trading higher with the Dow poised to open some 100 points up. Oil is also higher, but bonds, gold and the Dollar are lower (±5AM ET)... Read More