Art's Charts January 31, 2013 at 04:58 AM
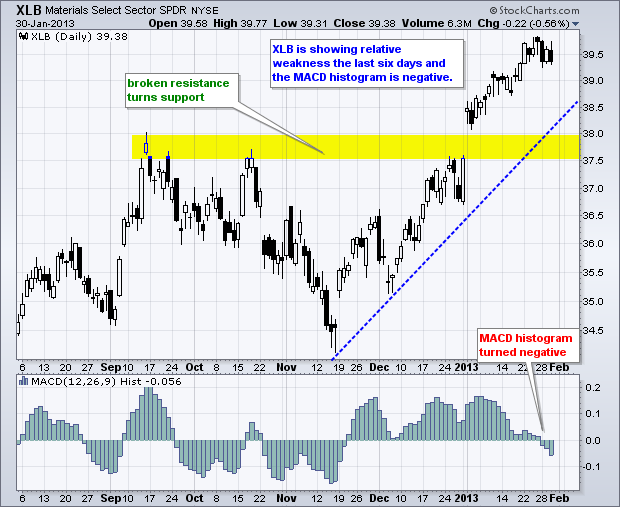
The bulls finally took a breather as stocks succumbed to some selling pressure on Wednesday. Small-caps led the way lower as the Russell 2000 ETF (IWM) fell over 1%. All sectors were down with the Industrials SPDR (XLI) falling .91% on the day... Read More
Art's Charts January 31, 2013 at 04:37 AM
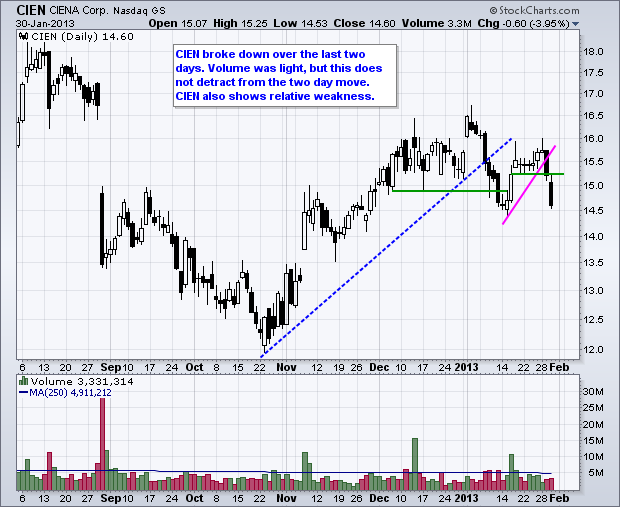
Careful out there. It is earnings season, the employment report is Friday and the new month starts. CIEN Breaks Down and Underperforms. MBI Forms Triangle and Bounces on Good Volume. Plus KO, S, USB, WSM This commentary and charts-of-interest are designed to stimulate thinking... Read More
Art's Charts January 30, 2013 at 05:38 AM
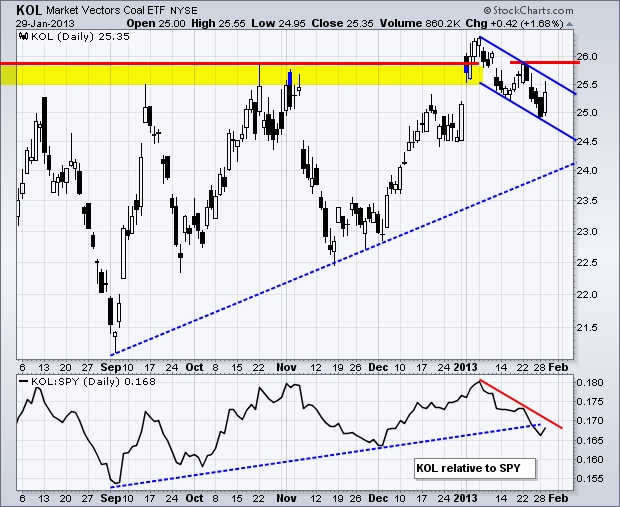
Stocks started the day weak, but then caught a bid and the broad market indices moved higher the rest of the day. The final gains were not that big with the S&P 500 ETF (SPY) advancing .39% and the Dow Industrials SPDR (DIA) closing .42% higher... Read More
Art's Charts January 29, 2013 at 05:35 AM
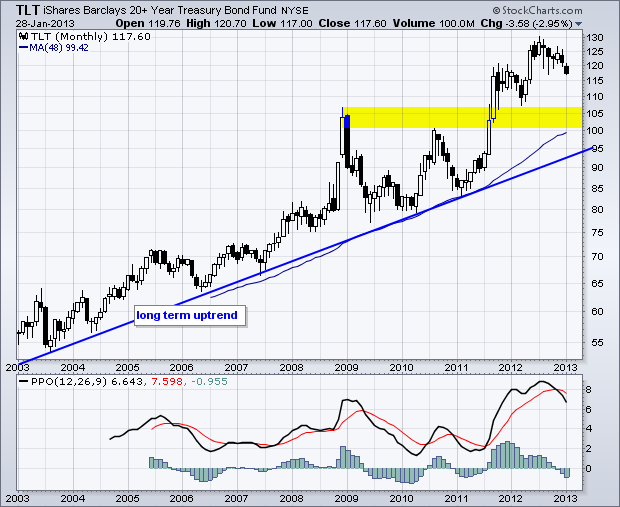
Stocks started the week mixed with the Russell 2000 ETF (IWM) edging higher and the S&P 500 ETF (SPY) edging lower. And I do mean "edging" because the moves were fractional... Read More
Art's Charts January 29, 2013 at 05:31 AM
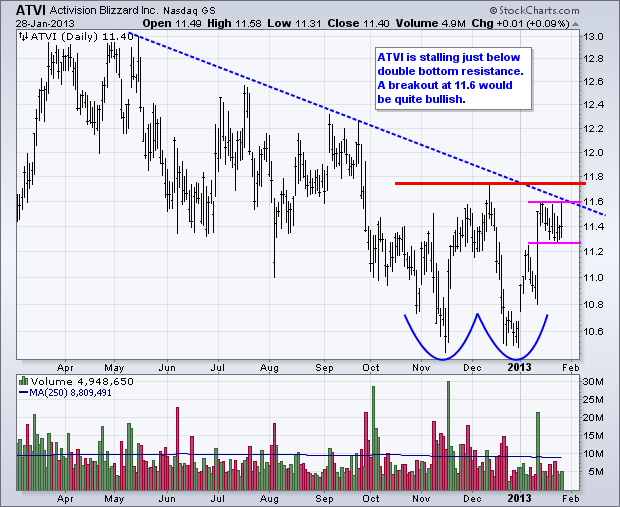
Careful out there. Earnings seaon is in full swing. ATVI Forms Flag Just Below Resistance. BIDU Breaks Flag Resistance with Volume. Plus CHS, CVG, EA, GME This commentary and charts-of-interest are designed to stimulate thinking... Read More
Art's Charts January 28, 2013 at 05:04 AM
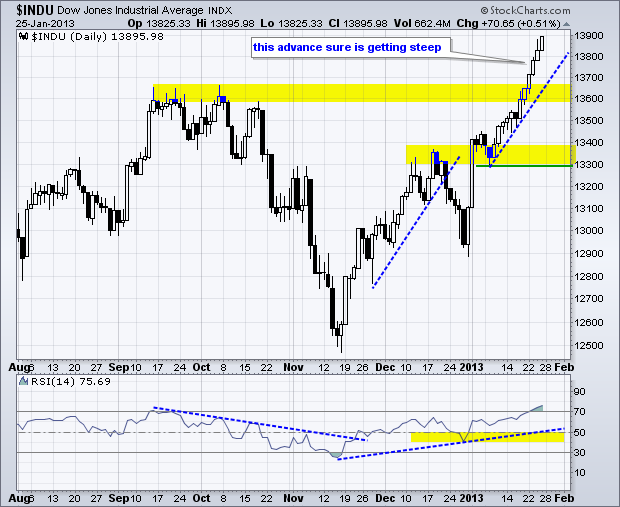
What more could a stock market want? The S&P 500 advanced the last eight days in a row and closed at a 52-week high. The Dow surged some 400 points in the last six days. Treasury bonds fell as market participants moved from safe-havens to riskier assets... Read More
Art's Charts January 25, 2013 at 06:13 AM
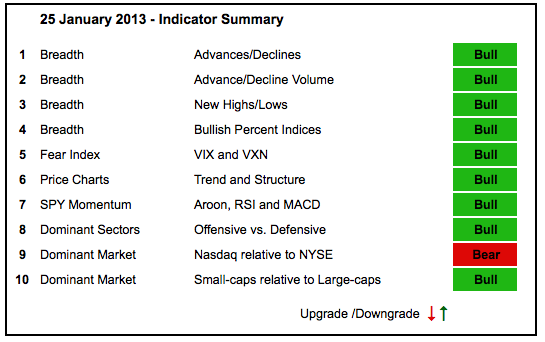
There are no changes in the indicator summary because stocks remained strong this week. QQQ and XLK were dragged down by Apple, but the Nasdaq 100 Equal-Weight ETF (QQEW) hit a new high, which means the average tech stock is doing just fine... Read More
Art's Charts January 25, 2013 at 04:44 AM
The broad market indices edged higher on Thursday, but Apple dominated ETFs moved lower (QQQ and XLK). Note that the Nasdaq 100 Equal-Weight ETF (QQEW) advanced .43% and the FirstTrust Internet ETF (FDN) was up over 2%... Read More
Art's Charts January 24, 2013 at 08:44 AM
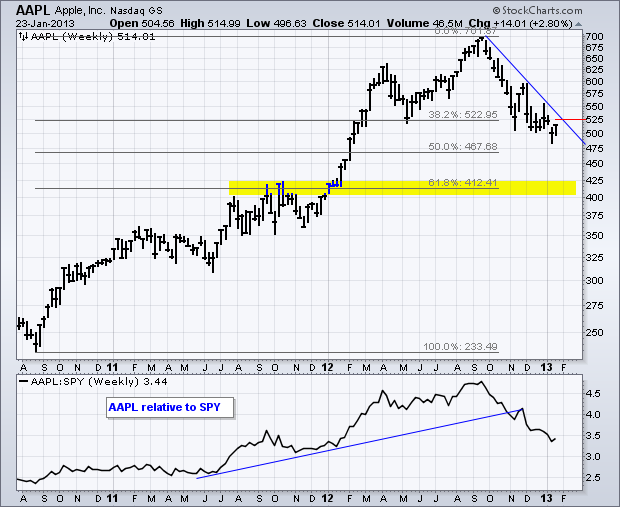
Apple whiffed and the stock is trading sharply lower after hours. This means the Nasdaq, QQQ and the Technology SPDR (XLK) will also be down in early trading on Thursday... Read More
Art's Charts January 24, 2013 at 05:33 AM
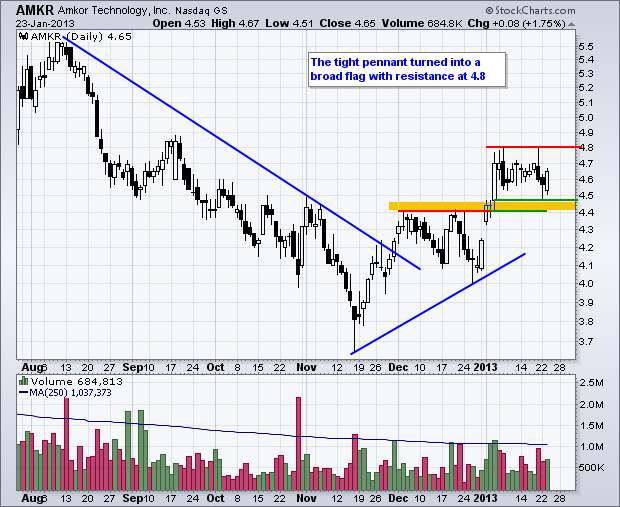
ESRX Underperforms and Tests Wedge Support. ORLY Firms at Support with Good Volume. Plus AMKR, JBL, PNRA, YUM This commentary and charts-of-interest are designed to stimulate thinking... Read More
Art's Charts January 23, 2013 at 05:04 AM
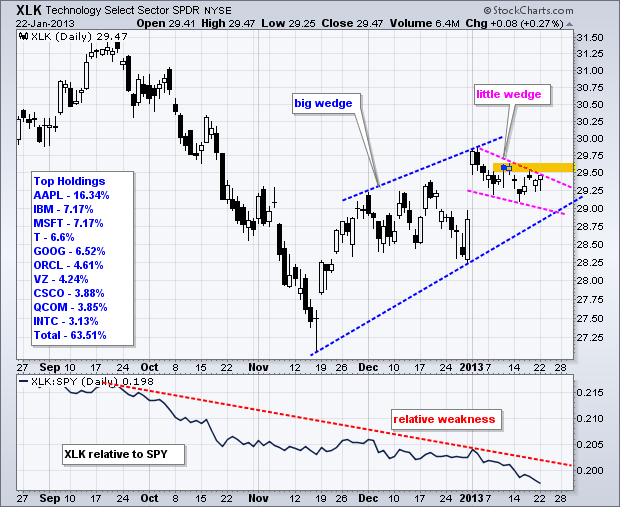
Stocks extended their gains on Tuesday with the Russell 2000 ETF (IWM) and S&P MidCap 400 SPDR (MDY) leading the way higher. Small-caps and mid-caps have been leading this market since mid November and show no signs of slowing down... Read More
Art's Charts January 22, 2013 at 06:01 AM
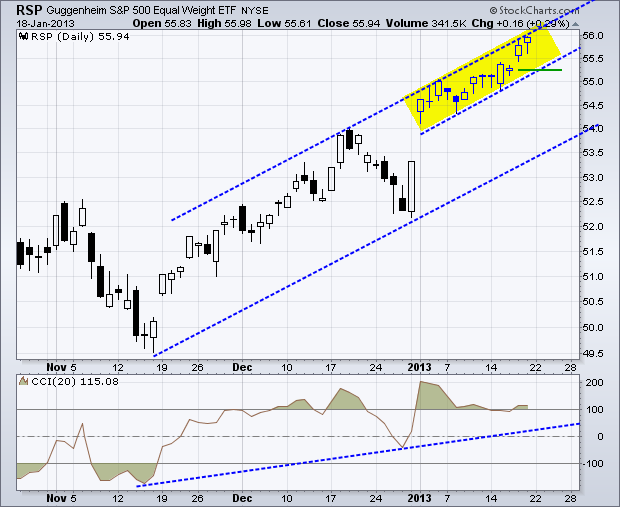
Stocks surged out of the gates to start 2013 and the S&P 500 ETF (SPY) closed at its highest level of the year (13 days). Buying pressure continues has we head into a big week for earnings. Some 100 reports are scheduled today, around 120 on Wednesday and over 200 on Thursday... Read More
Art's Charts January 22, 2013 at 05:54 AM
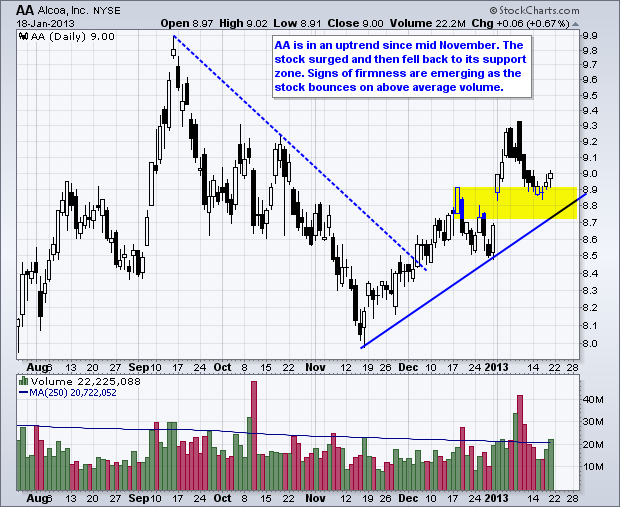
Care out there. It is earnings season. AA Falls back to Firs Support Zone. PCG Surges and Forms Pennant. Plus RDC and SO. This commentary and charts-of-interest are designed to stimulate thinking... Read More
Art's Charts January 18, 2013 at 06:13 AM
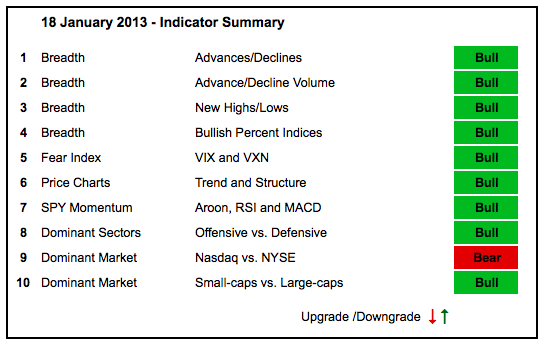
The only thing the bulls have to fear is bullishness itself. In other words, the bulk of the evidence is bullish, but stocks are getting overbought because the S&P 500 is up 10% since mid November (two months). The Russell 2000 ($RUT) is up over 15%... Read More
Art's Charts January 18, 2013 at 04:32 AM
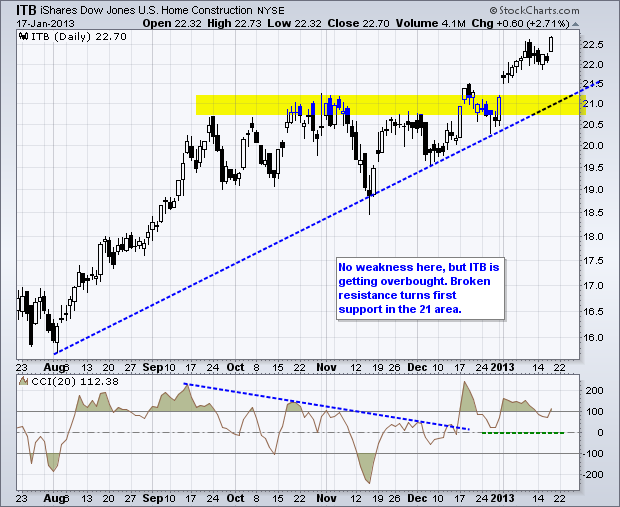
Stocks surged on Thursday with the S&P 500 hitting multi year highs. The Nasdaq and the Dow also surged and are poised to challenge their September highs. Stocks were buoyed by a surprisingly large jump in housing starts and a large decline in initial jobless claims... Read More
Art's Charts January 17, 2013 at 06:11 AM
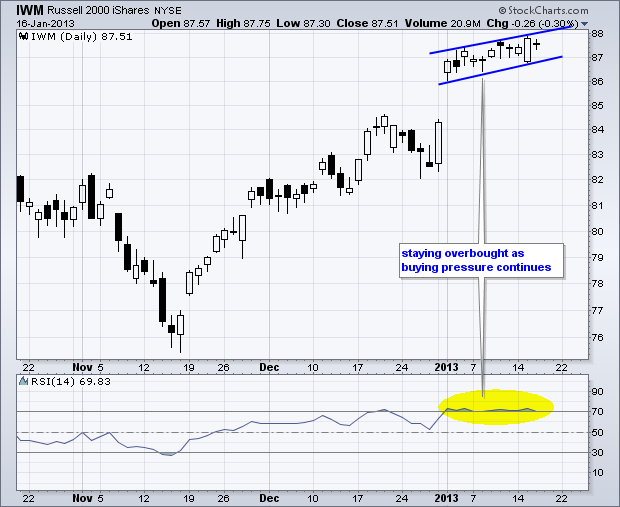
Trading remains mixed overall, but the bias is still bullish as the major index ETFs hold their New Year's gains. SPY, MDY, QQEW and IWM have edged higher since gapping up on 2-Jan. QQQ, which has been weighed down by Apple, has traded flat... Read More
Art's Charts January 17, 2013 at 05:50 AM
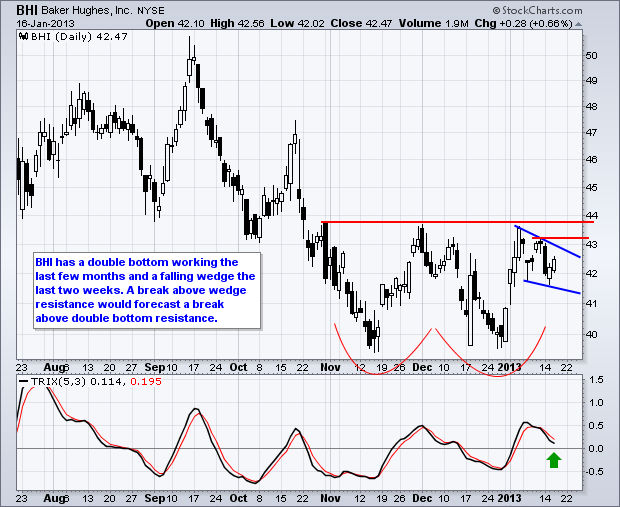
BRCM Holds Gap with Flat Flag. GRMN Breaks Support and Forms Bear Flag. Plus BHI, LH, ORLY, SCHL This commentary and charts-of-interest are designed to stimulate thinking... Read More
Art's Charts January 16, 2013 at 04:18 AM
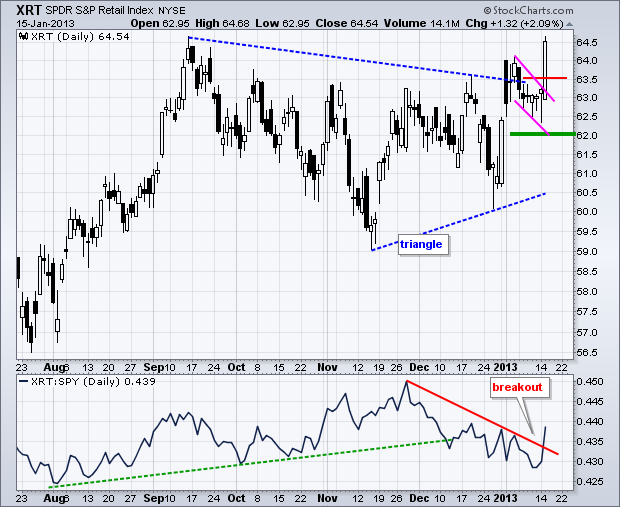
It is getting to be a familiar story. Stocks in general edged higher, but the Nasdaq 100 ETF (QQQ) edged lower because of weakness in Apple. AAPL broke support at 500 with a sharp decline on Tuesday. The company reports next Wednesday after the close... Read More
Art's Charts January 15, 2013 at 04:44 AM
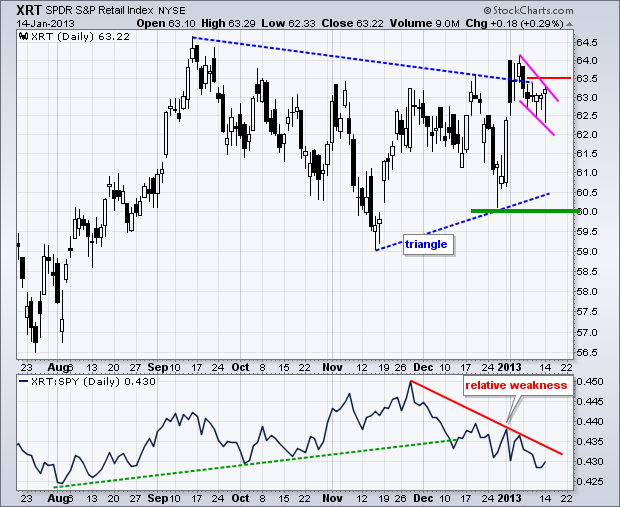
Stocks were mixed on Monday with the Dow Industrials SPDR (DIA) and Nasdaq 100 Equal-Weight ETF (QQEW) edging higher, while the Nasdaq 100 ETF (QQQ) and S&P 500 ETF (SPY) edged lower. QQQ was weighed down by weakness in QCOM, AAPL and GOOG... Read More
Art's Charts January 15, 2013 at 04:37 AM
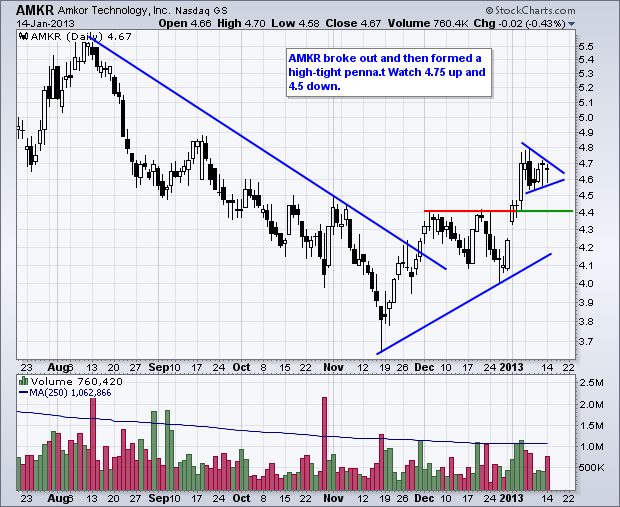
AMKR Forms High-Tight Pennant. AVP Firms at Key Retracement. Plus CSX, EA, IBM, KGC, RSD/A This commentary and charts-of-interest are designed to stimulate thinking. This analysis is not a recommendation to buy, sell, hold or sell short any security (stock ETF or otherwise)... Read More
Art's Charts January 14, 2013 at 05:56 AM
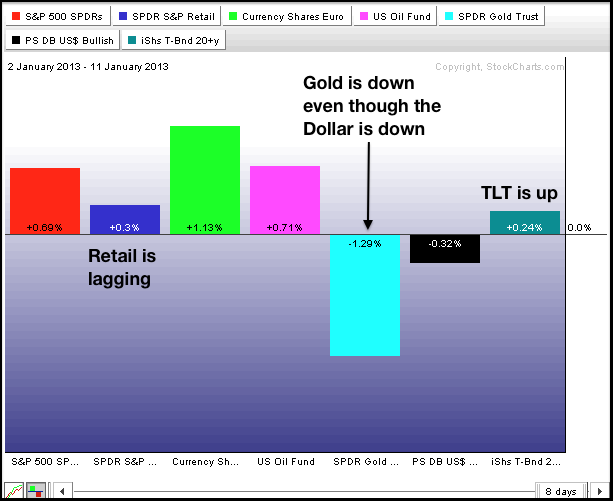
After big moves on 31-Dec and 2-Jan, stocks edged higher the last seven trading days. The S&P 500 ETF (SPY) closed at 146.06 on Wednesday (2-Jan) and at 147.07 on Friday (11-Jan)... Read More
Art's Charts January 11, 2013 at 05:37 AM
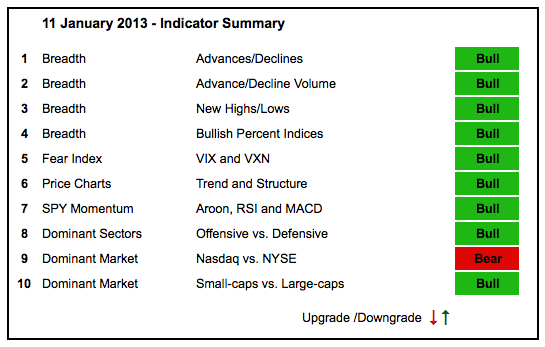
The vast majority of market indicators remain in bull mode. The Nasdaq AD Line broke above its December high this week and the Nasdaq AD Volume Line broke above its September high. The Nasdaq continues to lag the NY Composite, but tech stocks are starting to show a little life... Read More
Art's Charts January 11, 2013 at 04:10 AM
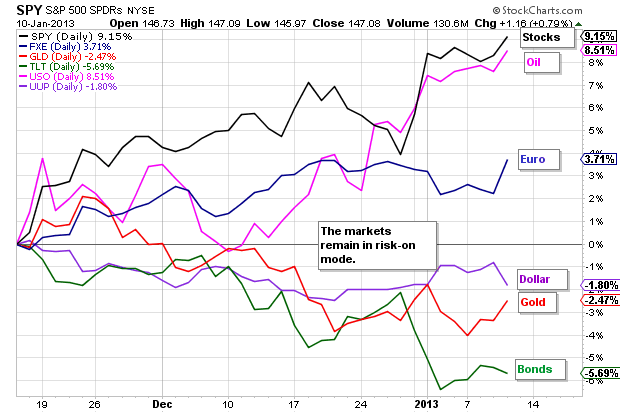
Stocks moved higher on Thursday with the major index ETFs scoring modest gains, very modest gains. The S&P 100 ETF (OEF) led the way with a whopping .80% advance. The Finance SPDR (XLF) led the sectors with a 1.27% gain on renewed confidence in US banks... Read More
Art's Charts January 10, 2013 at 06:02 AM
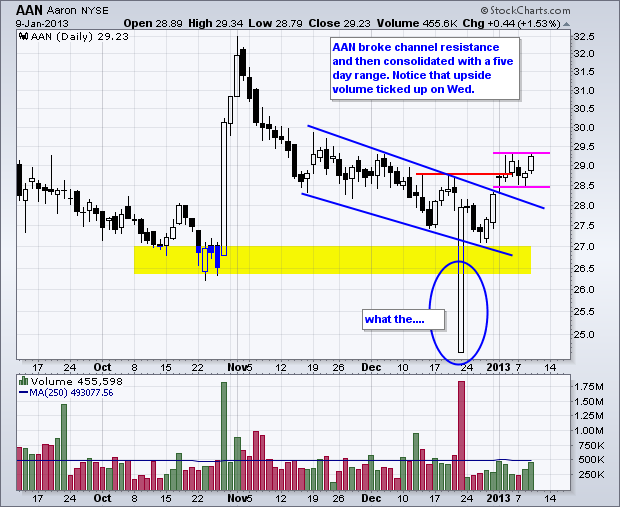
AAN Consolidates after Channel Break. BMC Breaks Resistance and Shows Relative Strength in 2013. Plus CVX, LH, VFC, VMW, XOM This commentary and charts-of-interest are designed to stimulate thinking... Read More
Art's Charts January 10, 2013 at 04:37 AM
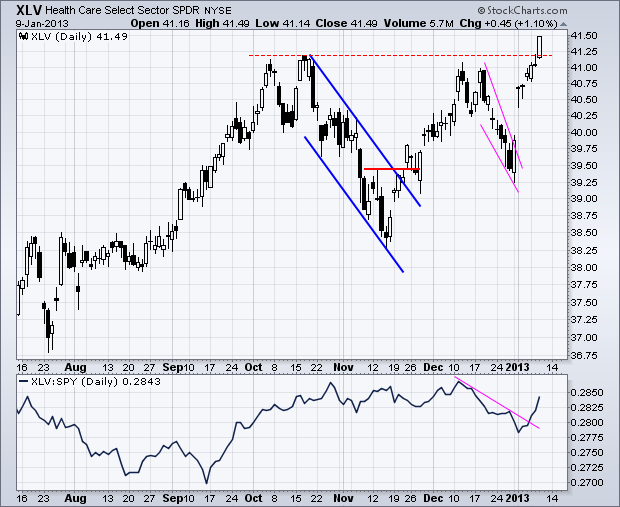
Stocks firmed on Wednesday with the major index ETFs putting in small gains for the day. The Nasdaq 100 Equal-Weight ETF (QQEW) led the way with a .78% advance and a fresh 52-week high. This is a clear sign that the Nasdaq 100 as a whole is strong... Read More
Art's Charts January 09, 2013 at 03:53 AM
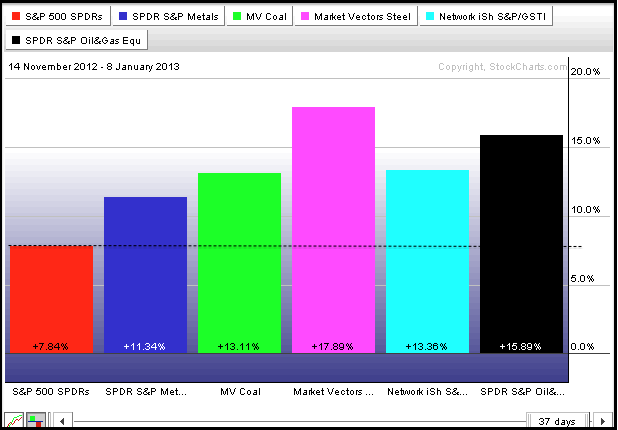
Stocks extended their corrective period on Tuesday as the major index ETFs finished with small losses. Note that stocks surged on 31-Dec and 2-Jan as the major index ETFs forged big gaps. Stocks were overbought at this stage and have pretty much consolidated the last few days... Read More
Art's Charts January 08, 2013 at 05:43 AM
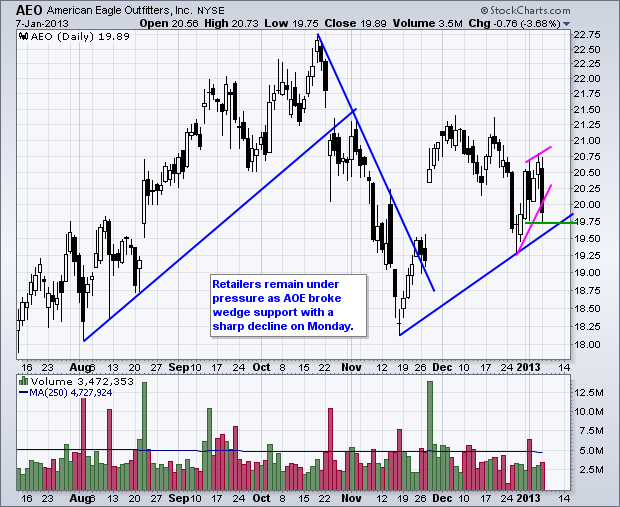
AEO Turns Sharply Lower. CTXS Holds Gap and Challenges Resistance. Plus GES, UDR, T, VZ This commentary and charts-of-interest are designed to stimulate thinking. This analysis is not a recommendation to buy, sell, hold or sell short any security (stock ETF or otherwise)... Read More
Art's Charts January 08, 2013 at 04:06 AM
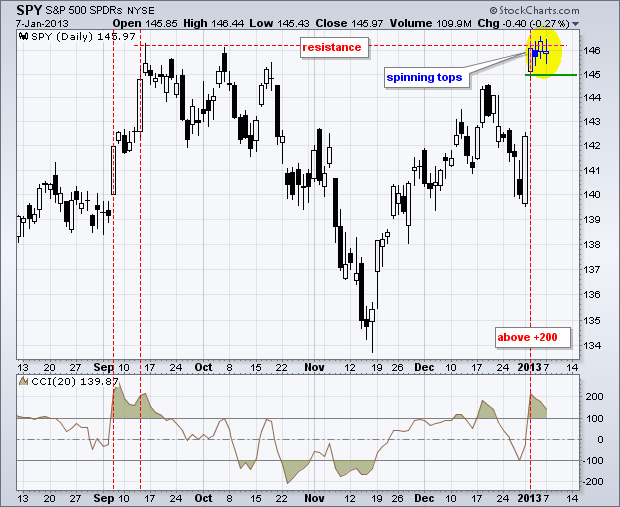
Trading was rather quiet as the world returned to work on Monday. The S&P 500 ETF (SPY) formed its third spinning top candlestick in as many days. Spinning tops feature small bodies (open-close range) and relatively equal upper-lower shadows (high-low range)... Read More
Art's Charts January 07, 2013 at 04:27 AM
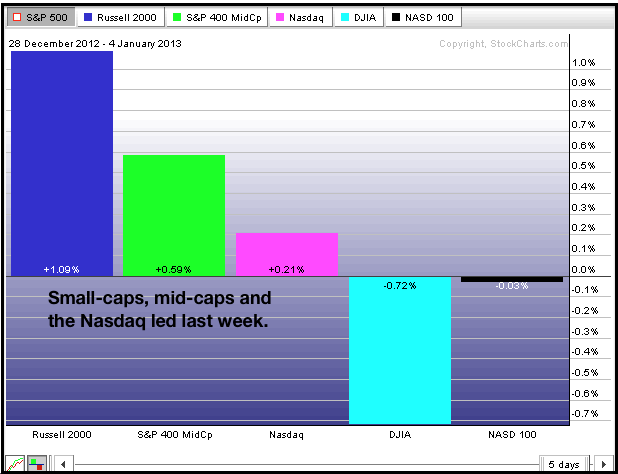
Stocks took a big bite of risk to start the year. Last week's gains were split between years with the surge starting on December 31st and continuing on January 2nd. Stocks consolidated the last two days of the week and held on to their gains... Read More
Art's Charts January 04, 2013 at 05:13 AM
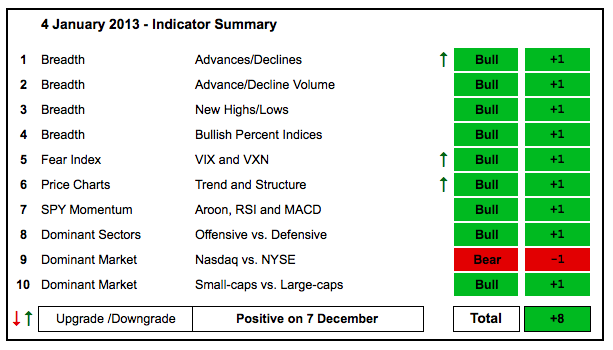
Strength over the past week triggered three upgrades for the indicator summary. The Nasdaq AD Line turned bullish with a break above its December high. The $VIX and $VXN plunged towards support to turn bullish... Read More
Art's Charts January 04, 2013 at 03:35 AM
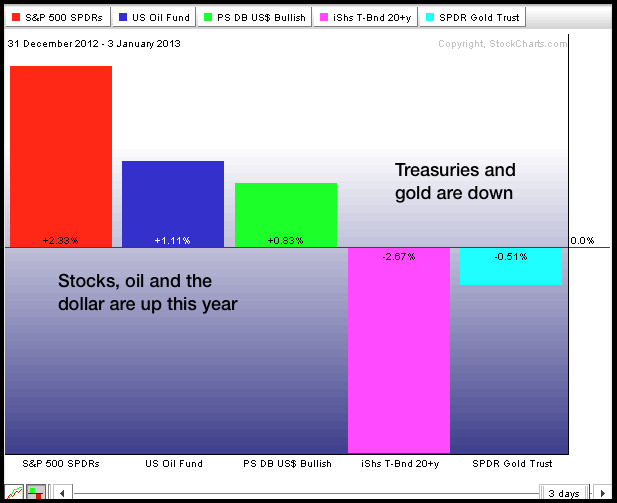
The Fed minutes threw the intermarket arena a curve ball on Thursday. Basically, the Fed admitted that the affects of quantitative easing were diminishing over time and it was running out of bullets... Read More
Art's Charts January 03, 2013 at 05:52 AM
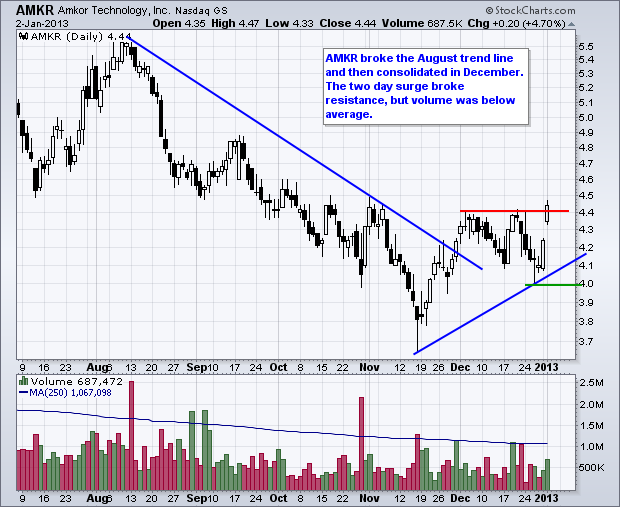
BOOM Breaks Consolidation Resistance with Good Volume. BSX Forms Inverse HS Pattern. Plus AMKR, IPI, NBR This commentary and charts-of-interest are designed to stimulate thinking... Read More
Art's Charts January 03, 2013 at 05:00 AM
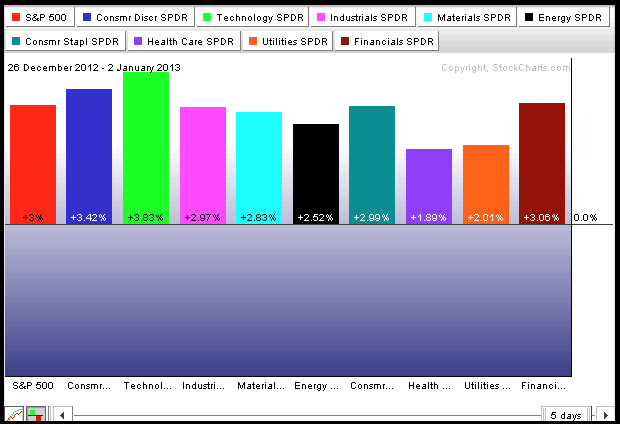
Stocks followed through on the New Year's Eve reversals with gaps and strong gains to start the year. The Russell 2000 ETF (IWM) and Nasdaq 100 ETF (QQQ) surged over 5% the last two days. IWM and the S&P MidCap 400 SPDR (MDY) recorded 52-week highs on Wednesday... Read More
Art's Charts January 02, 2013 at 05:55 AM
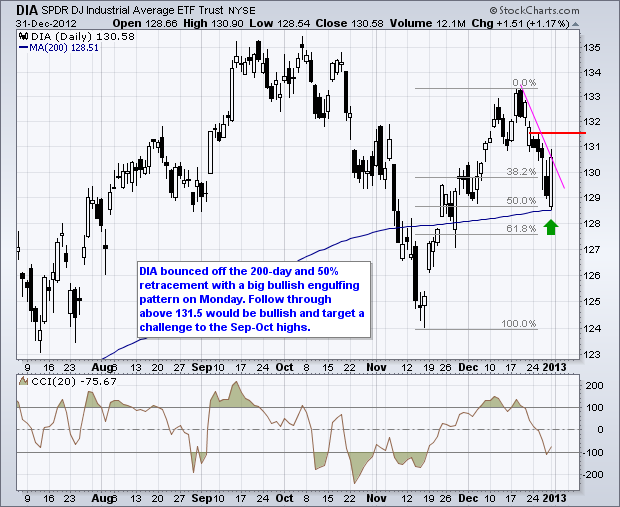
The markets got a taste for risk as the Senate debated the fiscal cliff on Friday. A bill did indeed pass by a wide margin and the House subsequently passed the bill as well. The bill does provide some relief from the fiscal slope, but does little to fix the long-term problems... Read More