Art's Charts August 30, 2013 at 08:09 AM
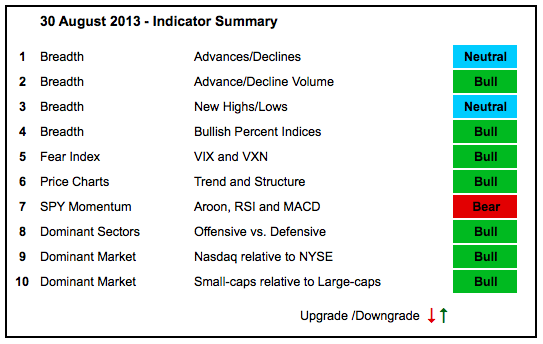
August was not a nice month for stocks. The S&P 500 is on schedule to post its biggest monthly loss since May 2012... Read More
Art's Charts August 30, 2013 at 07:04 AM
**This chart analysis is for educational purposes only, and should not be construed as a recommendation to buy, sell or sell-short said securities** Market action was mixed on Thursday with the Russell 2000 ETF (IWM) advancing around 1% and the S&P 500 ETF (SPY) advancing just ... Read More
Art's Charts August 29, 2013 at 10:20 AM
**This chart analysis is for educational purposes only, and should not be construed as a recommendation to buy, sell or sell-short said securities** Stocks got an oversold bounce on Wednesday, but the short-term trends remain down and this correction is likely to extent... Read More
Art's Charts August 29, 2013 at 10:15 AM
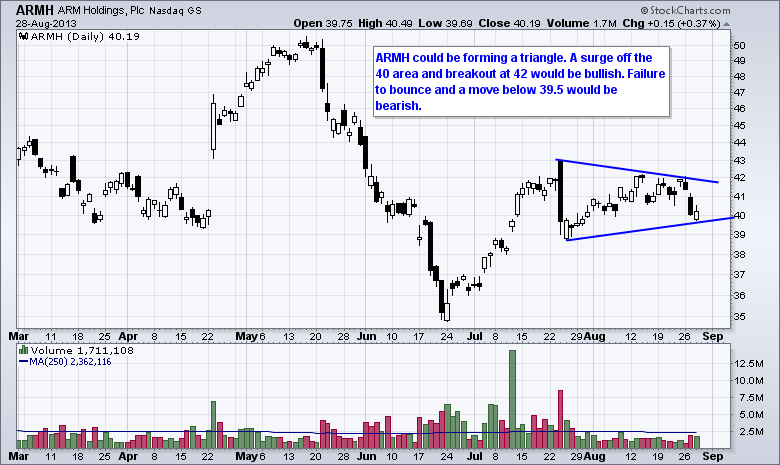
ARMH Firms with Potential Triangle Forming. AVGO Breaks Flag Resistance with Volume... Read More
Art's Charts August 28, 2013 at 06:55 AM
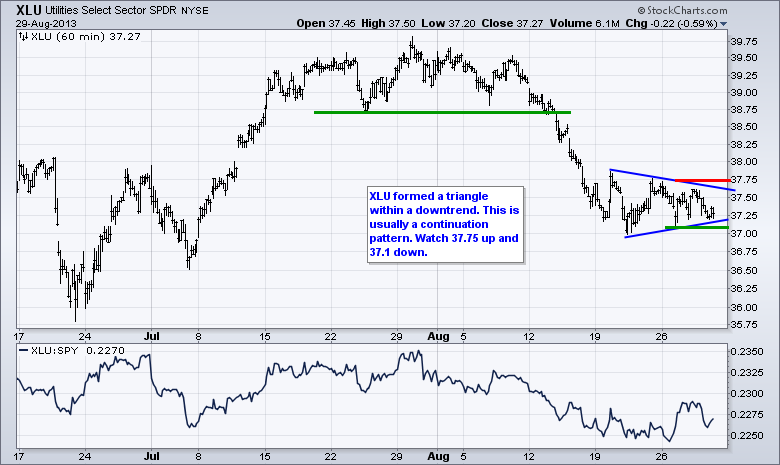
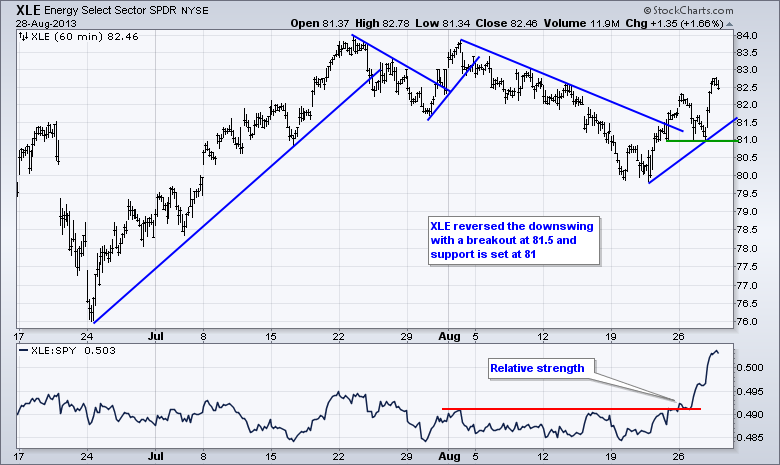
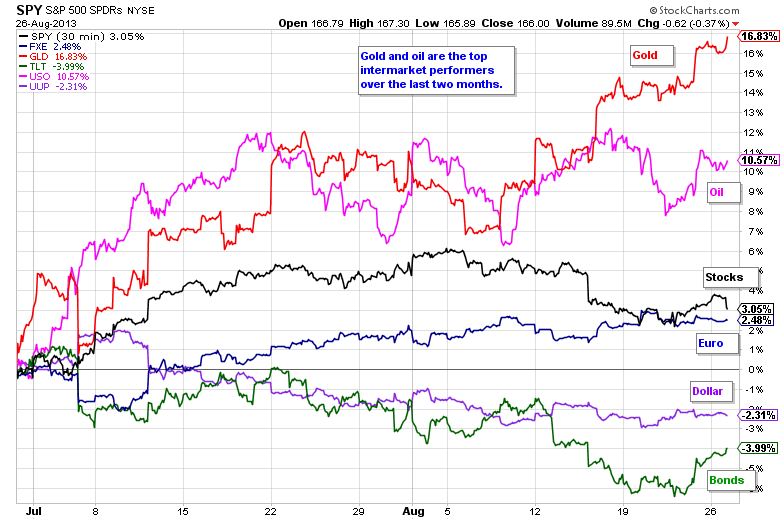
**This chart analysis is for educational purposes only, and should not be construed as a recommendation to buy, sell or sell-short said securities** It was a good old fashion flight to safety on Tuesday. Stocks moved broadly lower, while the safe havens moved higher... Read More
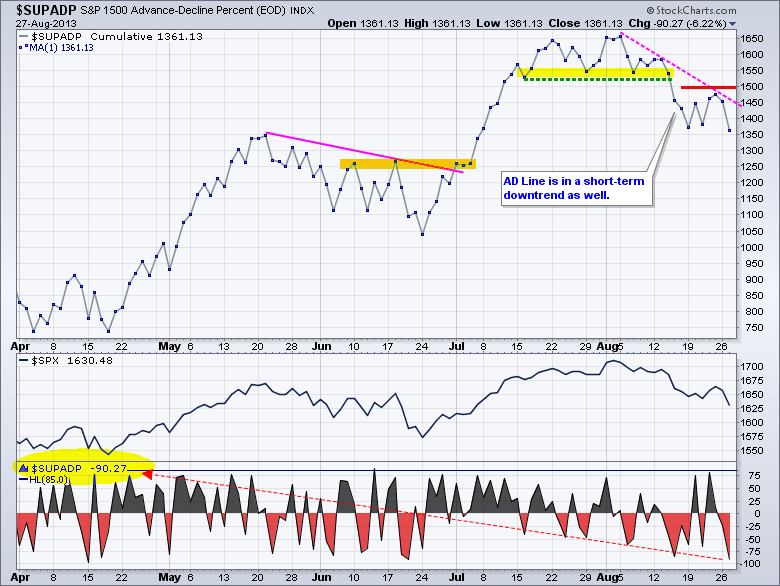
Art's Charts August 27, 2013 at 09:30 AM
**This chart analysis is for educational purposes only, and should not be construed as a recommendation to buy, sell or sell-short said securities** Despite a worse-than-expected durable goods report, stocks opened firmed and advanced in early trading... Read More
Art's Charts August 27, 2013 at 09:23 AM
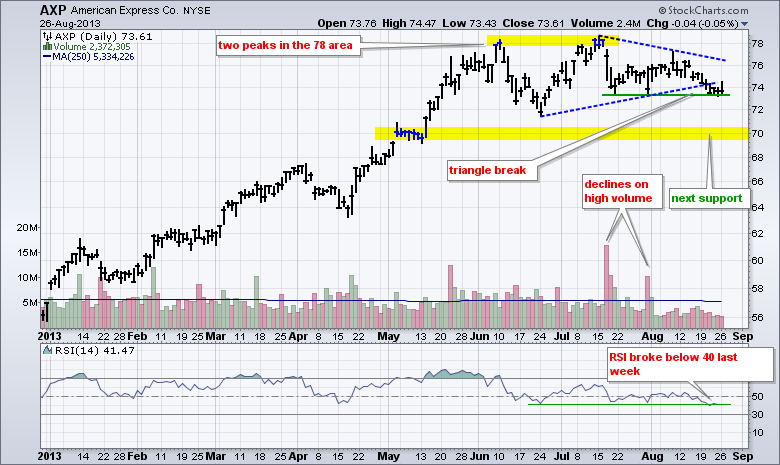
AXP Breaks Triangle Trend Line. CRM Forms Bear Flag... Read More
Art's Charts August 26, 2013 at 07:51 AM
**This chart analysis is for educational purposes only, and should not be construed as a recommendation to buy, sell or sell-short said securities** Stocks started the week under selling pressure, but finished strong with a rally on Thursday and Friday... Read More
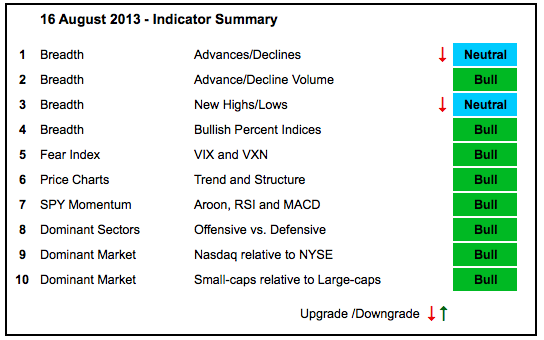
Art's Charts August 23, 2013 at 08:55 AM
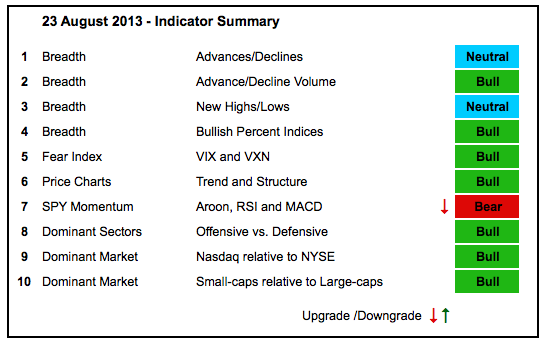
The bulk of the evidence remains bullish, but recent weakness took its toll on SPY momentum as this indicator trio turned bearish. Momentum indicators are leading indicators and will be the first to turn. However, they are also the most prone to whipsaws and bad signals... Read More
Art's Charts August 23, 2013 at 07:50 AM
**This chart analysis is for educational purposes only, and should not be construed as a recommendation to buy, sell or sell-short said securities** Stocks moved higher on Thursday with the Russell 2000 ETF (IWM) and S&P MidCap 400 SPDR (MDY) leading the way. Both gained over 1%... Read More
Art's Charts August 22, 2013 at 10:18 AM
**This chart analysis is for educational purposes only, and should not be construed as a recommendation to buy, sell or sell-short said securities** Stocks went on a wild afternoon run as the Fed minutes hit the tape... Read More
Art's Charts August 22, 2013 at 10:01 AM
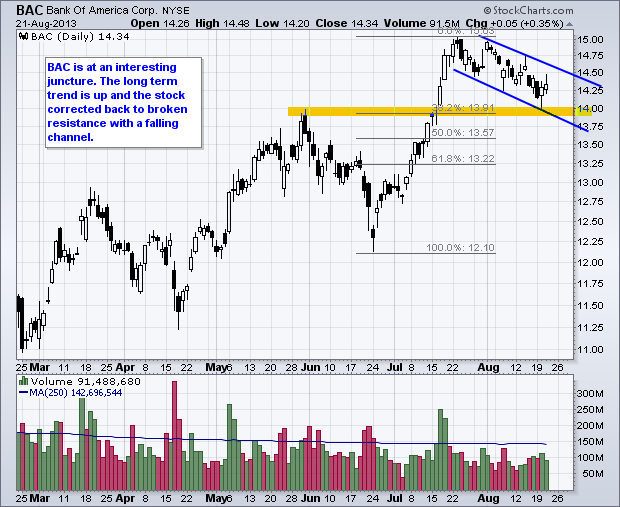
BAC Channels back to Broken Resistance. BIIB Firms after Pullback... Read More
Art's Charts August 20, 2013 at 09:37 AM
**This chart analysis is for educational purposes only, and should not be construed as a recommendation to buy, sell or sell-short said securities** Selling pressure continued in both stocks and Treasuries on Monday... Read More
Art's Charts August 20, 2013 at 09:21 AM
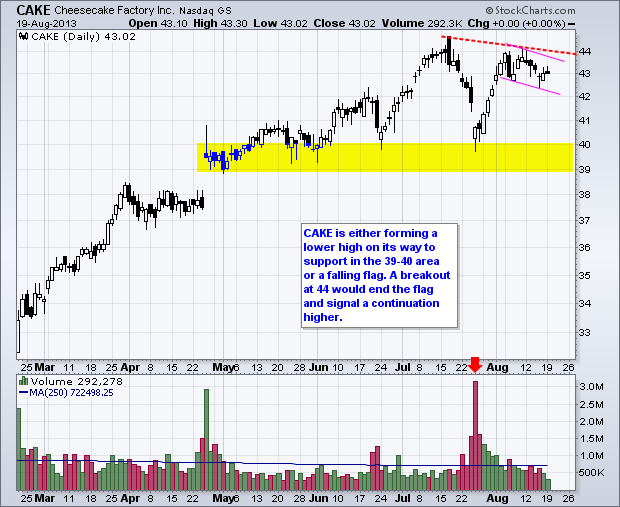
CAKE Stalls Below Prior High. HCA Extends Flag Correction... Read More
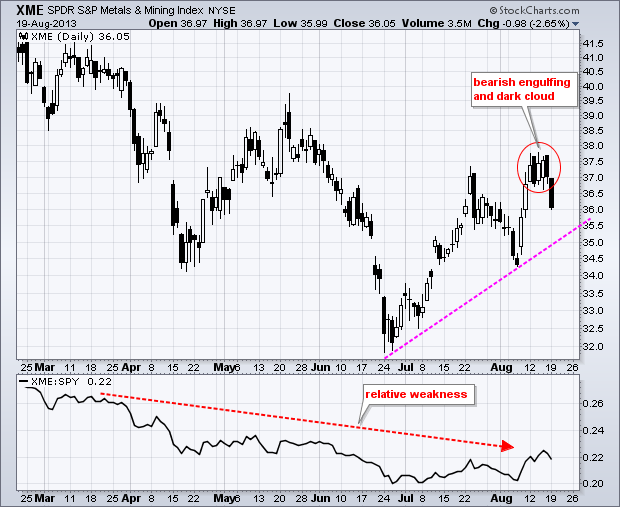
Art's Charts August 19, 2013 at 05:41 AM
Selling pressure hit the stock market for the second week running as the major index ETFs lost ground. The Russell 2000 ETF (IWM) fell 2.27% last week, while the Nasdaq 100 ETF (QQQ) lost just 1.31%... Read More
Art's Charts August 16, 2013 at 06:09 AM
Stocks were hit with broad selling pressure over the past week, but this is not enough to affect the overall uptrends. As we saw in November and June, corrections are normal in uptrends... Read More
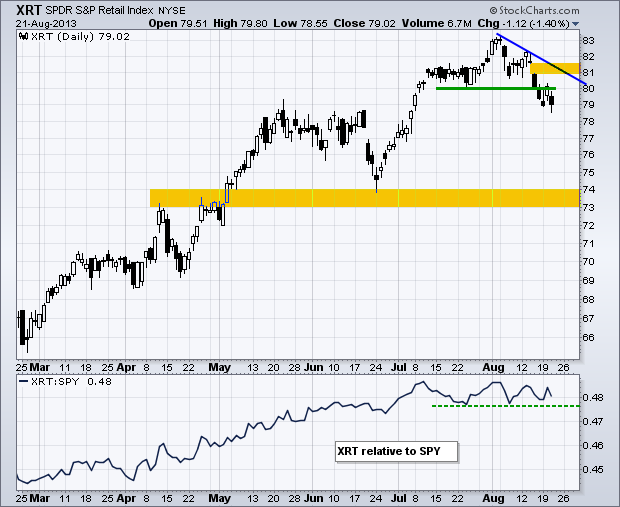
Art's Charts August 16, 2013 at 05:14 AM
Selling pressure certainly intensified on Thursday with an across the board decline. The high-beta Russell 2000 ETF (IWM) led the major index ETFs lower with a 1.82 percent decline. All sectors were down with the Consumer Discretionary SPDR (XLY) leading the way... Read More
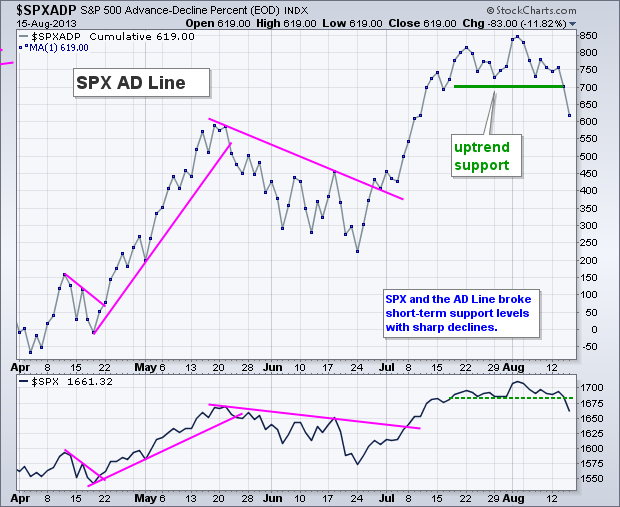
Art's Charts August 15, 2013 at 05:35 AM

Stocks opened weak and remained weak, but selling pressure was not that intense as the major index ETFs closed modestly lower. The Dow SPDR (DIA) and S&P Midcap SPDR (MDY) led the way by falling around .75 percent... Read More
Art's Charts August 15, 2013 at 05:29 AM
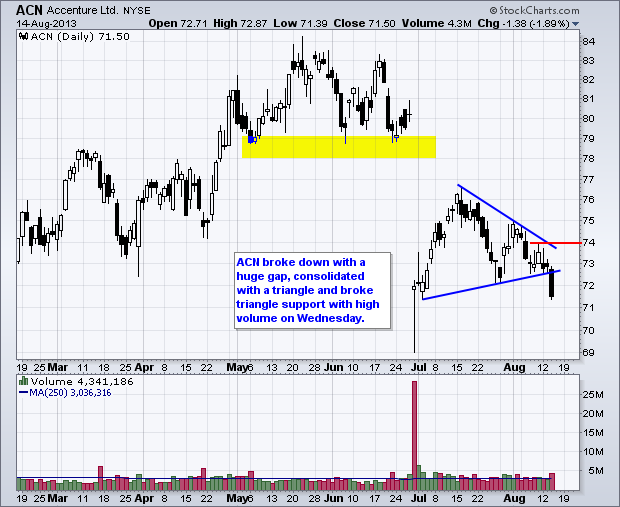
ACN Breaks Triangle Support with High Volume. AMD Bounces off Support with Good Volume... Read More
Art's Charts August 14, 2013 at 04:35 AM
Stocks meandered on Tuesday with the major index ETFs finishing mixed on the day. The Nasdaq 100 ETF (QQQ) advanced .56% on the heels of Apple, while the Russell 2000 ETF (IWM) fell .13% on the day... Read More
Art's Charts August 13, 2013 at 07:06 AM
Stocks opened weak on Monday, but quickly recovered and edged into positive territory. The overall gains were rather paltry with the Nasdaq 100 ETF (QQQ) gaining .24% and the Russell 2000 ETF (IWM) advancing .53%. The sectors were mixed with small gains and losses... Read More
Art's Charts August 13, 2013 at 07:01 AM
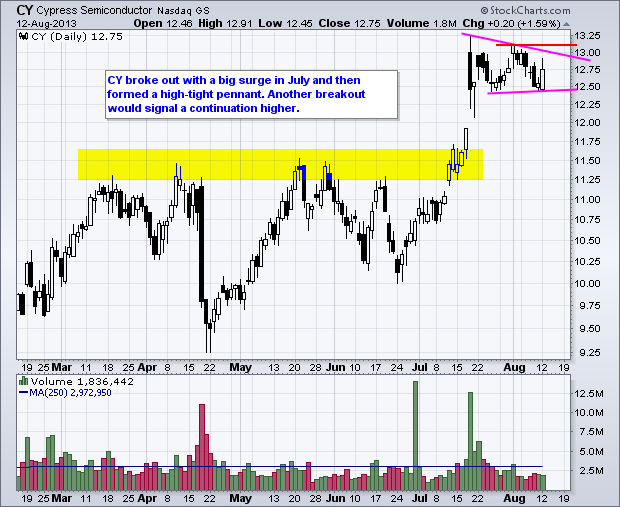
CY Consolidates after Big Surge. DE Bounces off Support with Good Volume... Read More
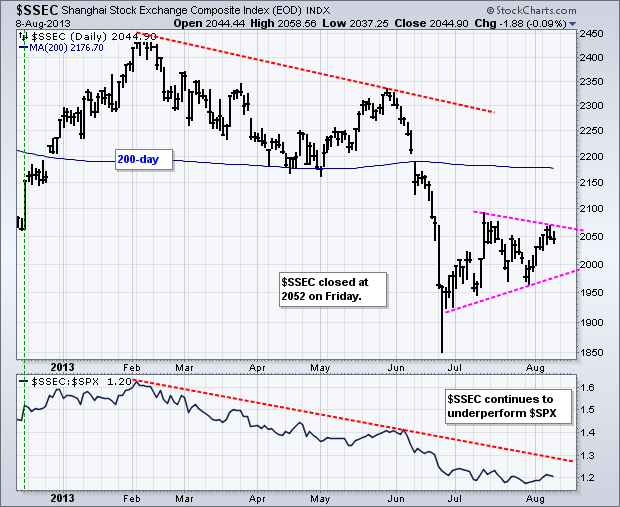
Art's Charts August 12, 2013 at 05:34 AM
The Shanghai Composite ($SSEC) and the Hang Seng Index ($HSI) surged over 2% on Monday, but the Nikkei 225 ($NIKK) fell and US stock futures are trading lower. Chinese shares are up because there were some positive economic reports late last week... Read More
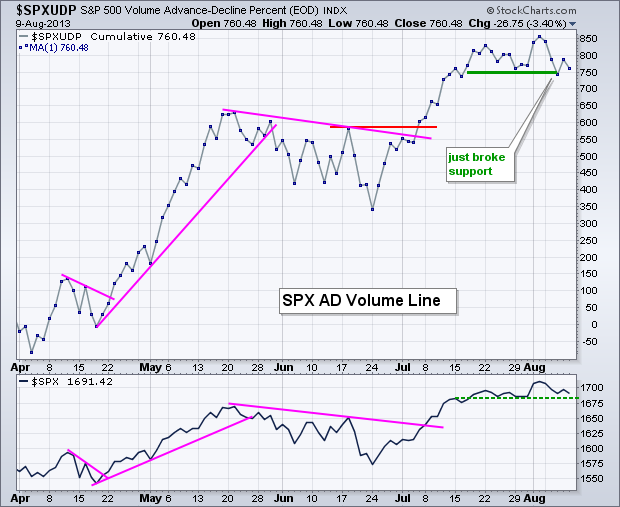
Art's Charts August 09, 2013 at 06:16 AM
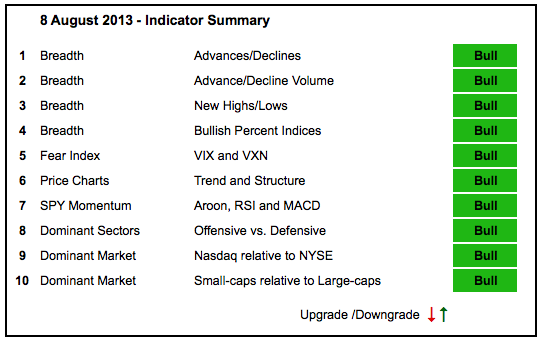
Stocks stalled over the last two weeks, but this was not enough to derail any indicators or the overall uptrend in the major index ETFs. Note that the major index ETFs hit new highs over the last two weeks, while XLK, XLY and XLI hit new highs to lead the sectors... Read More
Art's Charts August 09, 2013 at 05:14 AM
Stocks were all over the place on Thursday. The major index ETFs opened higher, quickly pulled back and then moved back into positive territory in the afternoon. The end result was uneventful as the Russell 2000 ETF (IWM) and Nasdaq 100 ETF (QQQ) advanced around 1/2 percent... Read More
Art's Charts August 08, 2013 at 06:05 AM
Stocks opened weak, but quickly firmed and consolidated at lower levels the rest of the day. The overall losses were small with the Russell 2000 ETF (IWM) loosing .71% and the Nasdaq 100 ETF (QQQ) falling just .18%... Read More
Art's Charts August 08, 2013 at 06:02 AM
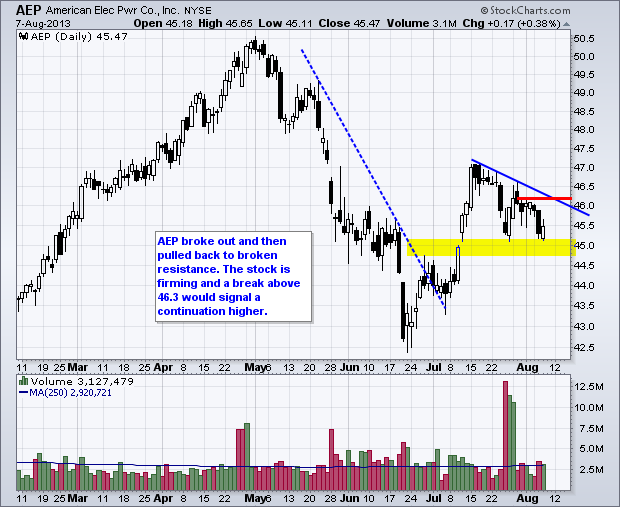
AEP Firms at Broken Resistance. AMX Surges to Consolidation Highs... Read More
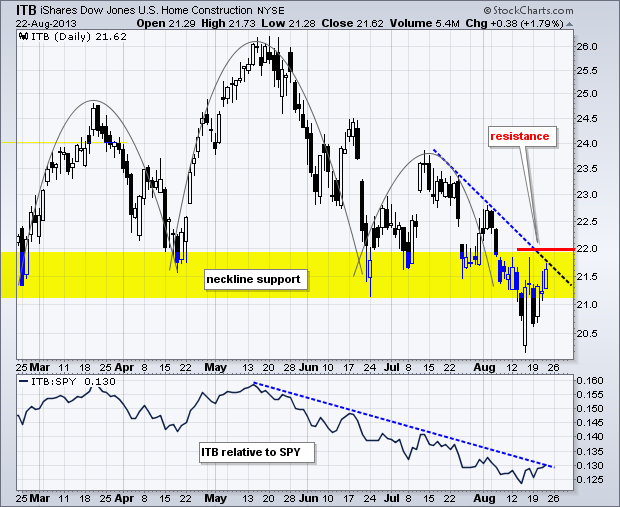
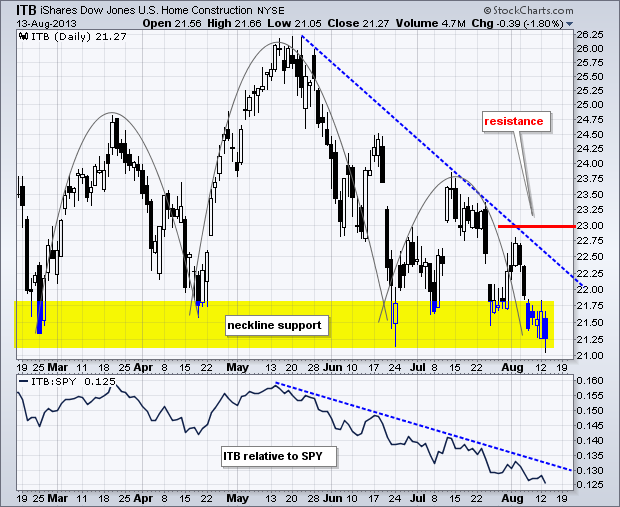
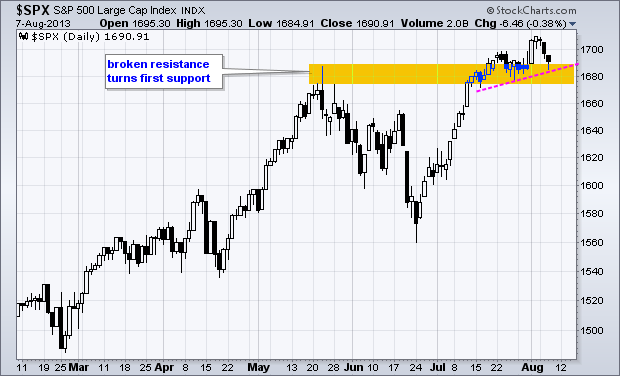
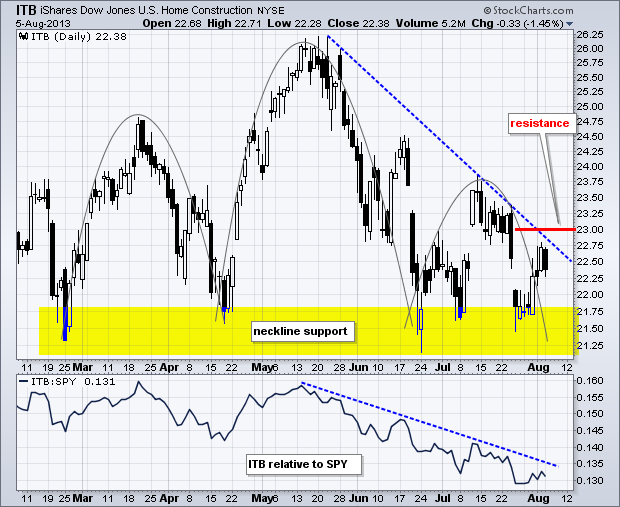
Art's Charts August 07, 2013 at 06:59 AM
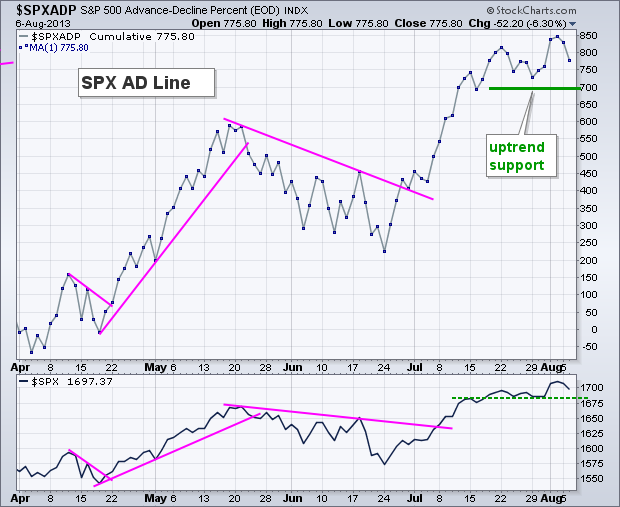
**This chart analysis is for educational purposes only, and should not be construed as a recommendation to buy, sell or sell-short said securities** Stocks pulled back on Tuesday with the Home Construction iShares (ITB), Gold Miners ETF (GDX) and Biotech SPDR (XBI) leading the wa... Read More
Art's Charts August 06, 2013 at 06:54 AM
**This chart analysis is for educational purposes only, and should not be construed as a recommendation to buy, sell or sell-short said securities** Stocks meandered on Monday. Trading was listless and volume was light. Yes, the dog days of summer are upon us... Read More
Art's Charts August 06, 2013 at 06:29 AM
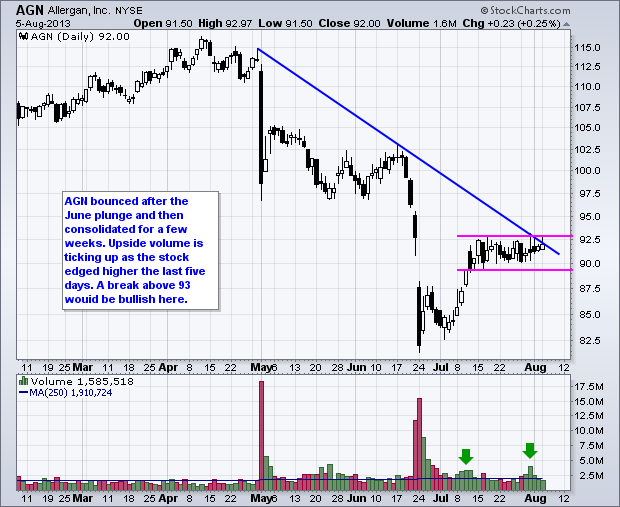
AGN Consolidates at Trend Line Resistance. D Forms Pennant after Big Surge... Read More
Art's Charts August 05, 2013 at 06:09 AM
It was a good week for the stock market. The major index ETFs gained and hit fresh 52-week highs. The Nasdaq 100 ETF (QQQ) and S&P MidCap 400 SPDR (MDY) led the way with 2+ percent gains... Read More
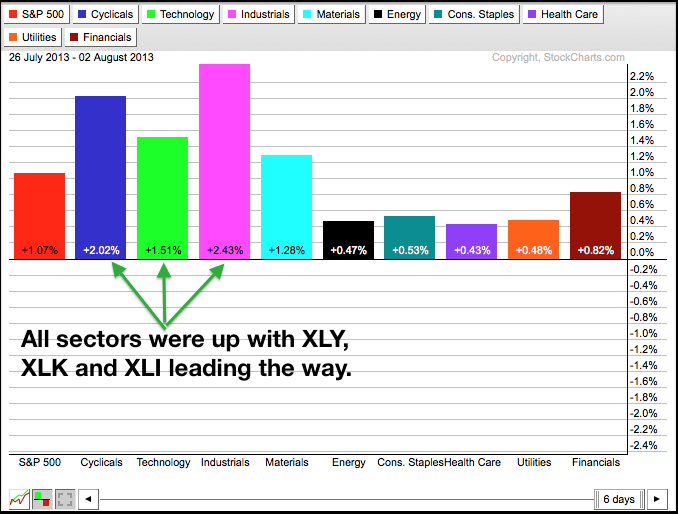
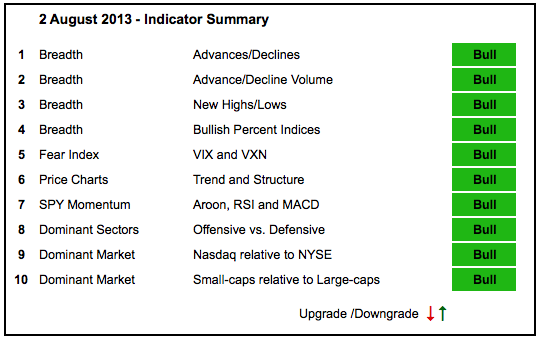
Art's Charts August 02, 2013 at 05:28 AM
The major index ETFs affirmed their uptrends with new highs this week. In addition, the Consumer Discretionary SPDR (XLY) and the Industrials SPDR (XLI) hit new highs, as did the Nasdaq AD Line and AD Volume Line. There are simply no signs of weakness in the market right now... Read More
Art's Charts August 02, 2013 at 04:41 AM
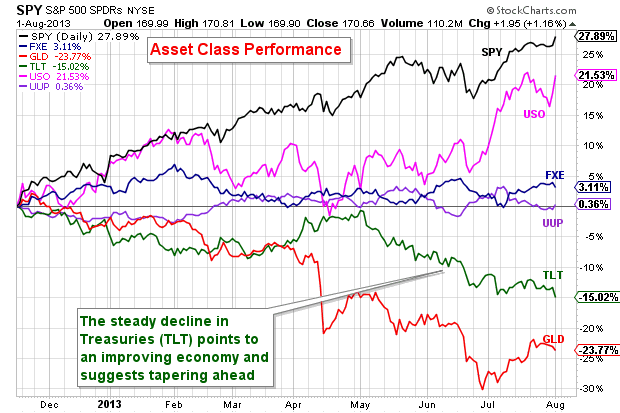
Stocks moved higher on positive economic news, and bonds moved lower. The ISM Manufacturing Index rose to 55.40, which is a two year high. Initial jobless claims fell to 326,000, which is the lowest level since January 2008... Read More
Art's Charts August 01, 2013 at 07:05 AM
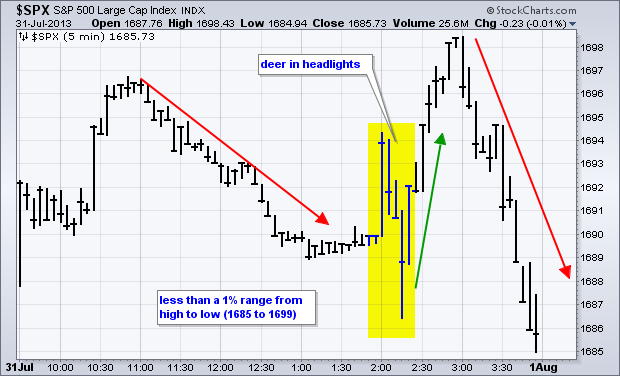
Stocks were all over the place on Wednesday, but the overall range was relatively small and the day-to-day change was miniscule. Stocks surged immediately after the Fed statement, peaked at 3PM and moved lower the final hour... Read More
Art's Charts August 01, 2013 at 07:02 AM
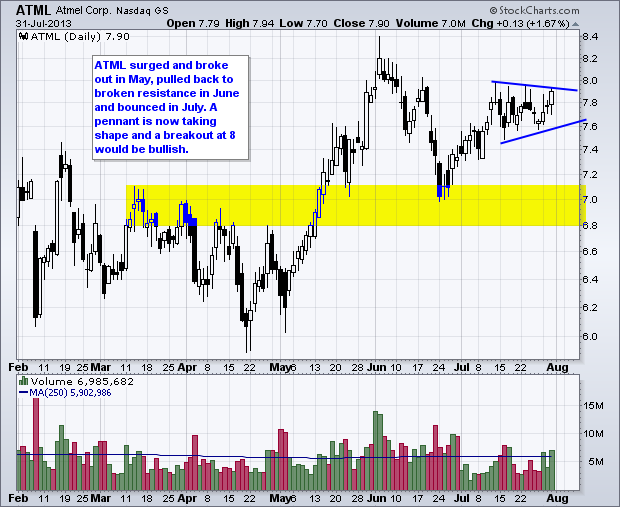
ATML Forms Continuation Pattern. CHS Show Signs of Accumulation. Plus FST, NVDA and SWKS ***Video edition is at the end*** iPad and iPhone Version This commentary and charts-of-interest are designed to stimulate thinking... Read More