... As a trend-momentum kind of guy, my first task is to find stocks with strong uptrends and this starts with a scan. Chartists looking for scan ideas should first find several visually appealing price charts and then study these charts carefully. Stocks like Autozone (AZO), Gallagher (AJG), Abbot Labs (ABT), American Tower (AMT), Proctor & Gamble (PG), Planet Fitness (PLNT), Twilio (TWLO), Verisign (VRSN), WorkDay (WDAY) and Yum Brands (YUM) have strong and steady uptrends that provided great examples for my scan development.
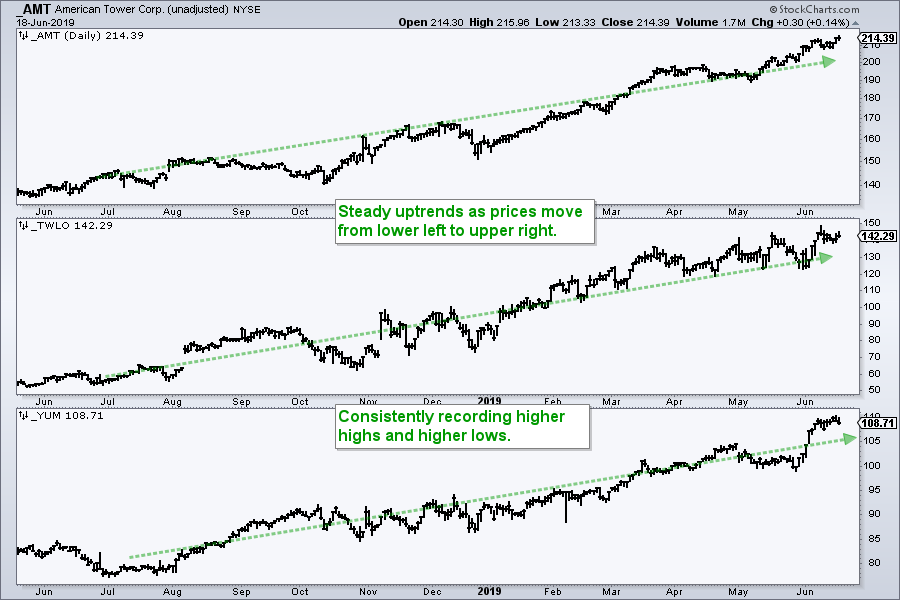
This article will explain the methodology behind a scan that I use to find stocks with strong uptrends. Over the years, I have come to the conclusion that there are two main parts to an uptrend. First, prices must move higher on a consistent basis and regularly forge higher highs. Second, prices must hold above their prior lows on a consistent basis and regularly forge higher lows. Both parts are needed for an uptrend to remain consistent and persistent.
This is the first of two articles on using RSI and Aroon to find strong and steady uptrends.
Click here for the second article
Indicators and Timeframe
The scan in this article uses two indicators to find stocks with both trend characteristics. First, I am using RSI to find stocks with strong upside momentum and limited downside momentum. Second, I am using Aroon Up/Down to find stocks that are regularly making higher highs and not making lower lows.
Typically, I am looking for stocks that show strong trend and momentum characteristics over at least a three month period. Keep in mind that this is just a scan for the initial cut. In addition, chartists can make adjustments to suit their trading or investing style. Sometimes I must tighten the scan criteria if there are too many results and I need to cull the herd.
Momentum Thresholds for RSI
Even though RSI is mostly used as a short-term indicator to identify overbought and oversold levels. It can also be used on longer timeframes to identify the overall trend. RSI, which stands for Relative Strength Index, is perfectly suited for trend identification because it measures the average gain relative to the average loss. Prices, therefore, are clearly moving higher as long as the average gain exceeds the average loss on a given time frame.
RSI oscillates between zero and one hundred with fifty as the midpoint. RSI is above 50 when the average gain for the period is greater than the average loss and below 50 when the average loss is greater than the average gain. The further above 50, the stronger the average gain.
Technical analysis is often part objective and part subjective. The RSI formula and midpoint (50) are the objective parts. The other parameters form the subjective parts of the equation: RSI periods, RSI upside momentum threshold, RSI downside momentum threshold. I decided on 65-day RSI, which covers three months of price action. For the upside momentum threshold, I want to see RSI move above 55 on a regular basis. For the downside momentum threshold, I would like to see RSI hold above 45 on a regular basis (limited pullbacks). This 45-55 range may seem tight, but 65-day RSI oscillates in a much narrower range than 14-day RSI. The objective is to find stocks that consistently show strong upside momentum (RSI>55) and limited downside momentum (RSI>45).
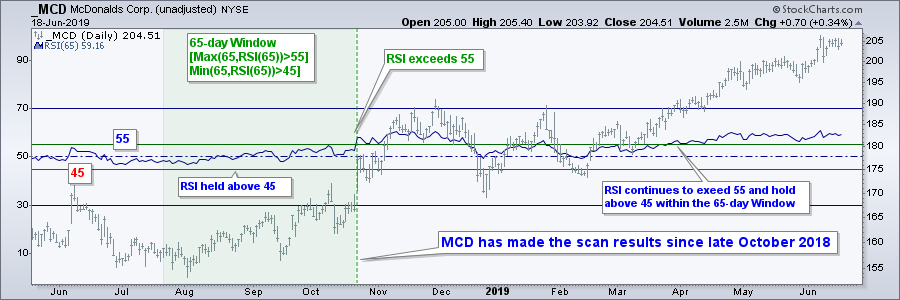
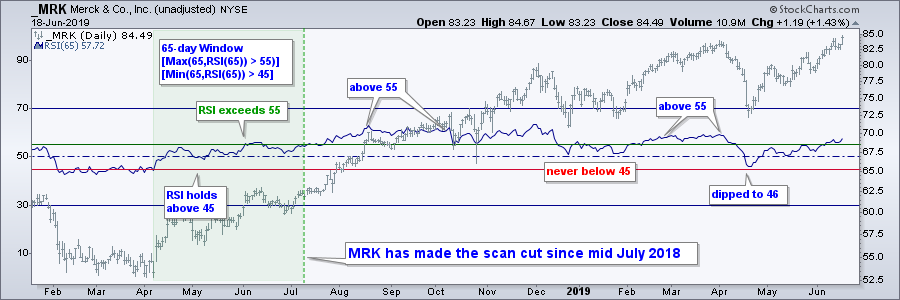
How often should 65-day RSI exceed 55 and hold above 45? Instead of counting the number of instances, I opted for a timeframe. I would like to see RSI(65) exceed 55 and hold above 45 for at least 65 days (three months). The MCD and MRK charts shows 65-day price windows when RSI exceeded 55 at least once and did not dip below 45. The green dashed lines mark the end of this 65-day window and the date when both stocks made the cut.
65-day Highs and Lows with Aroon
Now we turn to Aroon Up and Aroon Down to measure 65-day highs and lows. 65-day Aroon Up hits 100 when price records a 65-day high, while 65-day Aroon Down hits 100 when price records a 65-day low.
On a chart, we can also measure 65-day highs and lows using Price Channels. The chart below shows Workday (WDAY) with 65-day Price Channels and 65-day Aroon Up/Down. The upper line of the Price Channel marks the prior day's 65-day high, while the lower line marks the prior day's 65-day low (intraday).
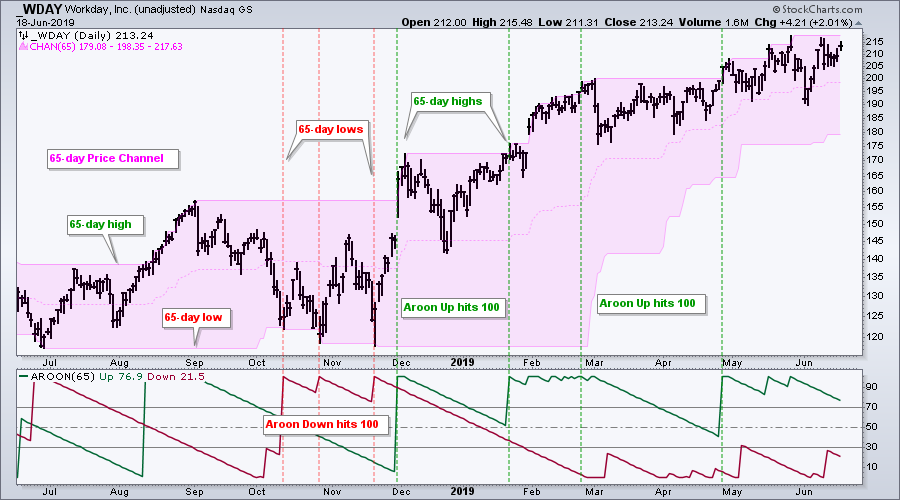
Notice how Aroon Down (65) hit 100 in October and November as the intraday low dipped below the lower line of the Price Channel. WDAY then surged above the upper line in late November and Aroon Up (65) hit 100. Since late November, the stock has regularly recorded 65-day highs without any 65-day lows. As with RSI above, I am looking for Aroon Up to exceed 100 at least once every 65 days and for Aroon Down not to exceed 100 for 65 days.
Scan Code
Now its time to quantify these two indicators in the advance scan workbench. The scan code below is divided into two parts. The first part narrows the universe to stocks that are trading above $10 and have an average volume above 300,000 shares. The second part of the scan code applies the RSI and Aroon signals. The last line is an extra moving average filter that can be added.
[country is US]
and [group is not ETF]
and [group is not UtilitiesSector] // wanted to exclude this sector
and [group is not RealEstateSector] // wanted to exclude this sector
and [[exchange is NYSE] or [exchange is NASD]]
and [SMA(20,Close) > 10] and [SMA(20,Close) * SMA(20,Volume) > 5,000,000]
and [Min(65,RSI(65)) > 45]
and [Max(65,RSI(65)) > 55]
and [SMA(20,Close) > SMA(200,Close)]
and [Max(65,Aroon Up(65)) > 99]
and [Max(65,Aroon Down(65)) <99]
Text to the right of the forward slashes (//) is ignored by the scan engine and used to make notes. Click here to learn more about writing scans.
A ChartList can hold 500 symbols maximum. A recent run of this scan returned 577 results and this means it would need some tightening to get under the 500 result threshold. Increasing the volume requirement from 300,000 to 500,000 shares shortened the list by around 20% to 441 results. I could also raise the RSI bearish threshold from 45 to 48. Leaving volume at 300,000 and increasing the RSI bearish threshold to 48 also shortened the list by around 20% (474 results).
Conclusions and Next Steps
This scan is designed to find stocks with strong and steady uptrends. Stocks that fit the criteria should show a progression of higher highs and higher lows on the price chart. Chartist can then export these results to a ChartList for further study. At the very least, I run this scan once per week, export the results to a ChartList and then review using the CandleGlance option. This shows 30 charts per page and makes it easy to make the next cut. In particular, I am looking for stocks that have some sort of short-term bullish setup (falling flag, falling wedge, triangle, correction or retracement).
Arthur Hill, CMT Senior Technical Analyst, StockCharts.com Author, Define the Trend and Trade the Trend
Want to stay up to date with the latest market insights from Arthur?
– Follow @ArthurHill on Twitter – Subscribe to Art's Charts – Watch On Trend on StockCharts TV (Tuesdays / Thursdays at 10:30am ET)


