 Semiconductors are holding up relatively well over the last few weeks. While many stocks and ETFs broke their August lows, the Semiconductor SPDR (XSD) held its August low and the Semiconductor ETF (SOXX) did not even test its August lows. Today we will compare and contrast the two ETFs and then look at some individual stocks.
XSD and SOXX are two different beasts covering the same industry group. The Semiconductor SPDR (XSD) is a broad-based ETF with 35 stocks that are more or less equally weighted. The top five stocks account for 16.5% of the ETF weighting and the top ten stocks account for 32.6%.
The chart below shows XSD consolidating within an uptrend. The ETF hit new highs in April and July, it remains above the rising 200-day SMA and the 65-day SMA of RSI(10) is above 50.
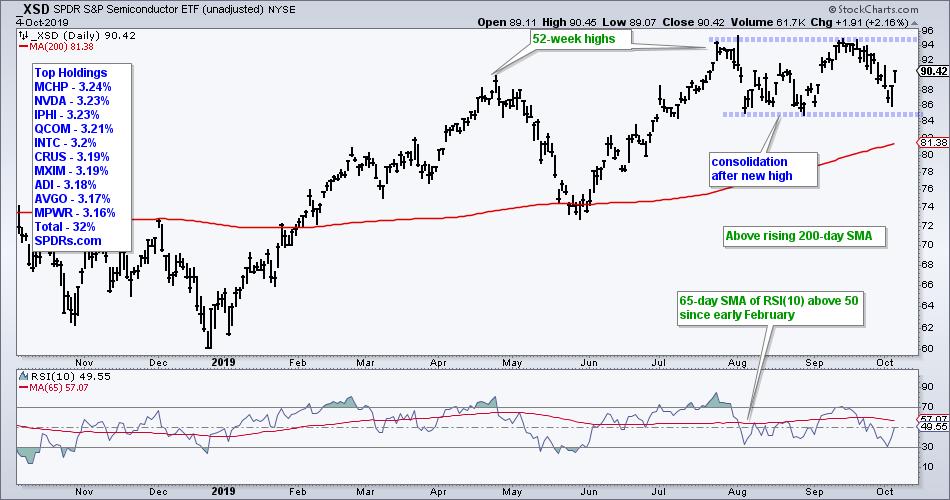
The ETF consolidated with a trading range the last two months and a consolidation after an advance is typically a bullish continuation pattern. XSD reversed near support on Thursday as RSI(10) touched 30 to become oversold. We also saw follow through on Friday.
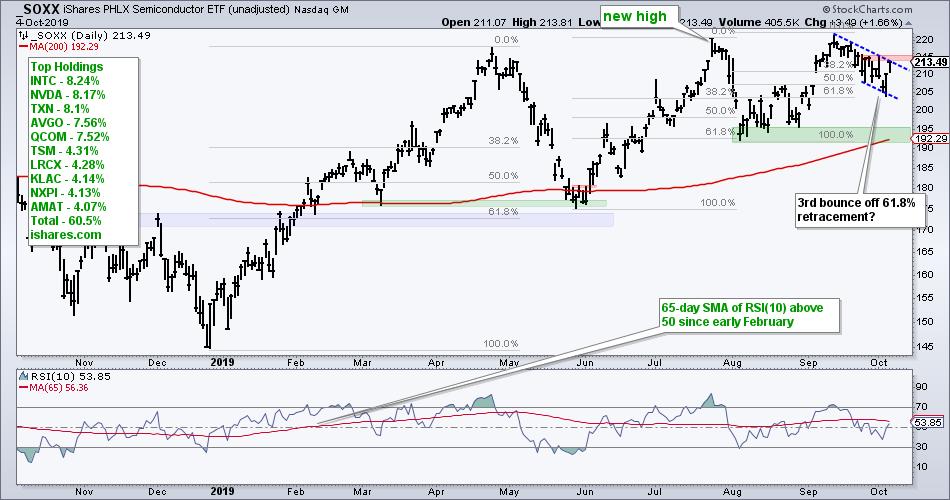
The Semiconductor ETF (SOXX) has 31 stocks, but its components are weighted by market-cap. The top five stocks account for around 39.6% of the ETF and the top ten stocks account for 60.5%. The top names include Intel (INTC), Nvidia (NVDA), Texas Instruments (TXN), Broadcom (AVGO) and Qualcomm (QUAL).
I covered SOXX on Thursday and it is in the top tier as far as my ETF rankings and groupings are concerned. Whereas XSD is back near the August low, SOXX remains well above this low and shows relative strength. The ETF also reversed near the 61.8% retracement with a bull flag taking shape. A break above the flag line and above the red resistance zone would be bullish.
------------------------------------------------------------
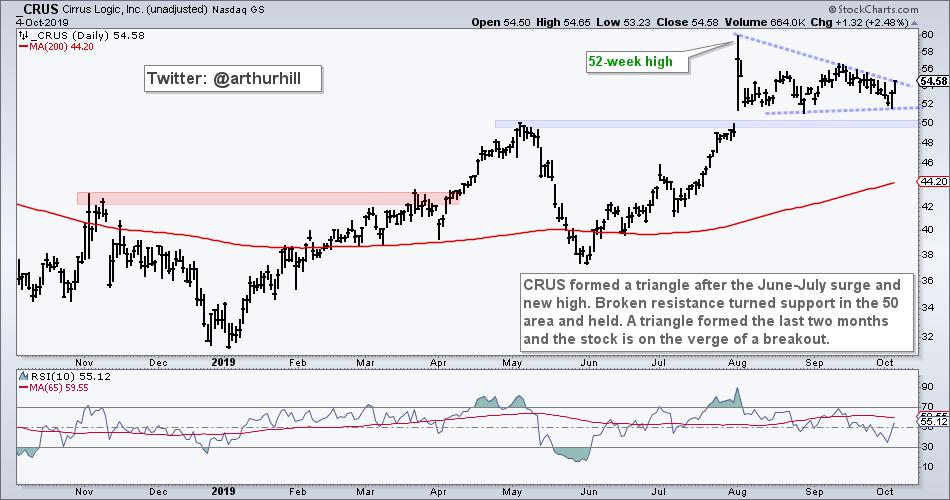
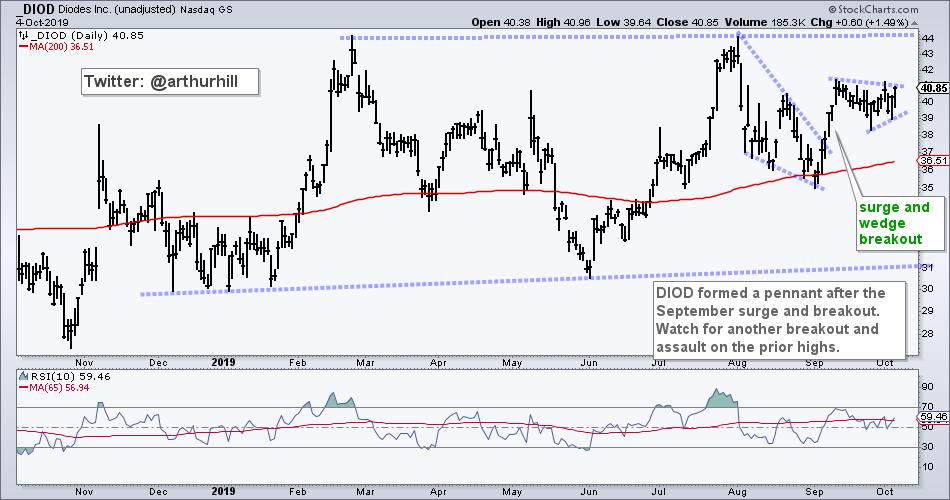
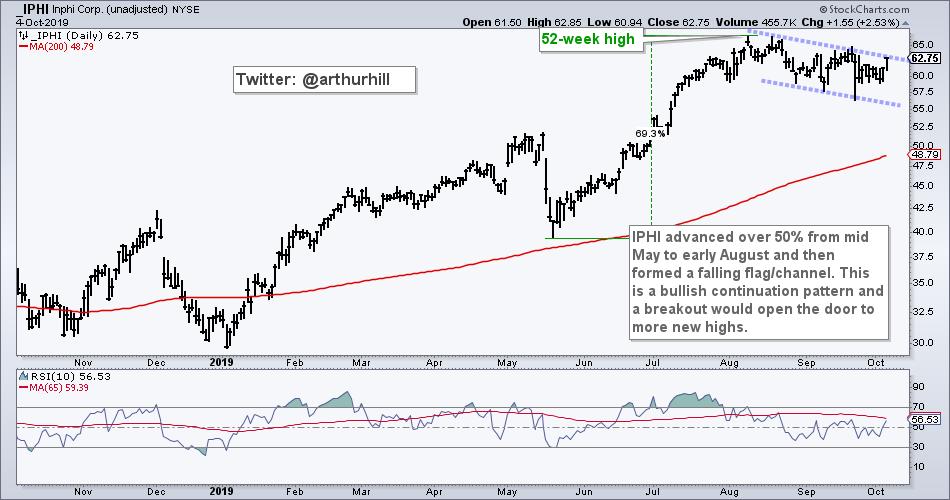
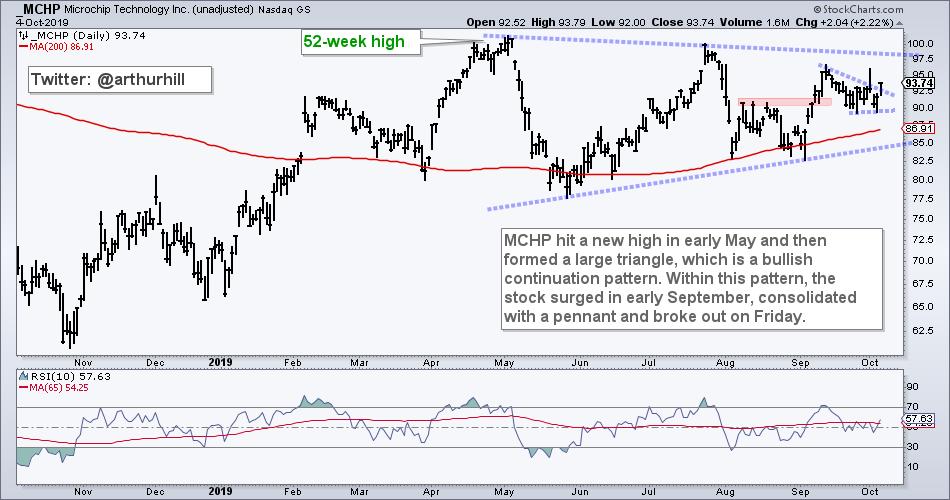
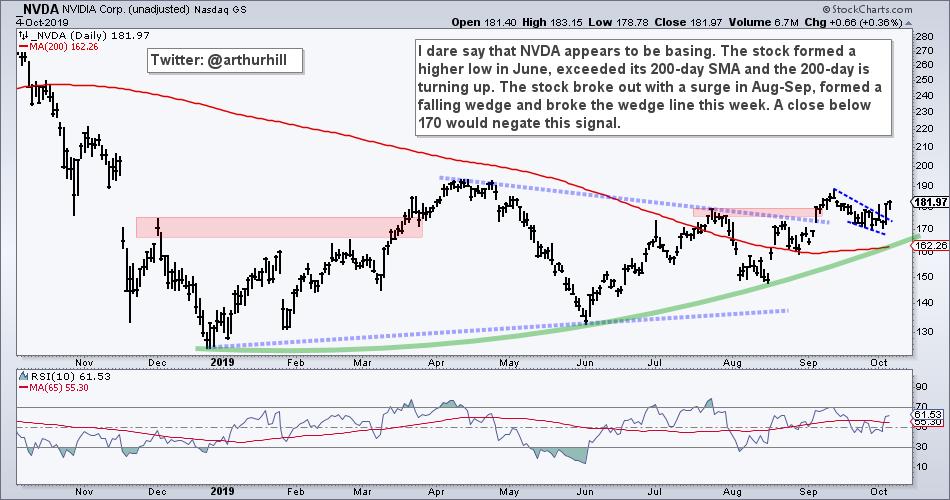
7 Semis to Watch
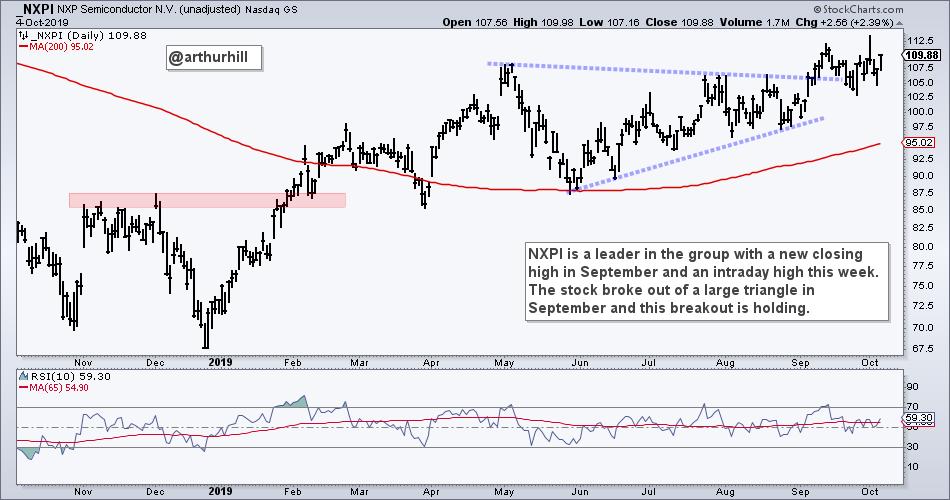
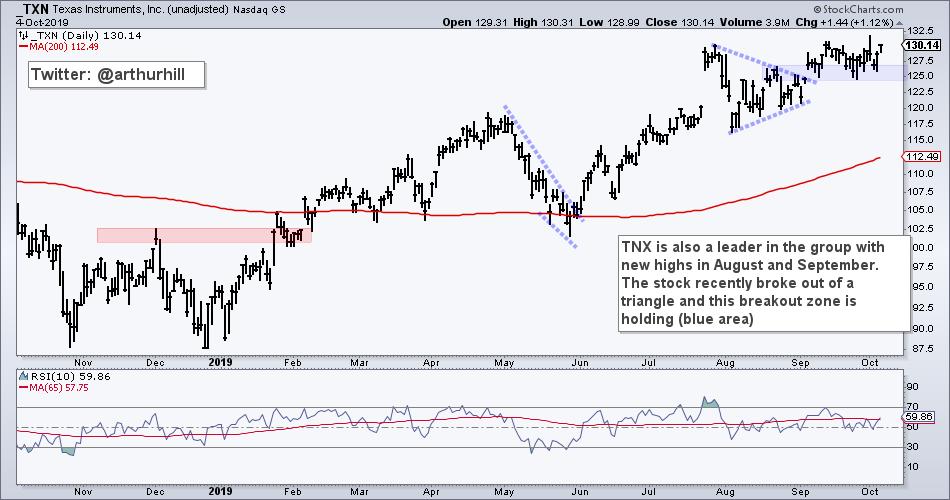
The next charts come from the Semiconductor ETF (SOXX) and the Semiconductor SPDR (XSD). All stocks are in uptrends of some sort because they are above their rising 200-day SMAs and the 65-day SMA of RSI(10) is above 50. Some are stronger than others and even leading (TXN, NXPI), while one could be forming a big bottom (NVDA). My main stock picking strategy is to look for bullish continuation patterns when the bigger trend is up.
------------------------------------------------------------
This Week on Art's Charts
Saturday - 5-Oct: The State of the Stock Market - A Stock Picker's Market
Thursday - 3-Oct: Ranking and Grouping ETFs - SPY Consolidates, GLD Flies the Flag and SOXX Holds Strong
Wednesday - 2-Oct: Some Key Equal-Weight Sectors are Under Pressure
Tuesday - 1-Oct: Follow Up to Sunday Setups - When is the Rationale Invalidated?
------------------------------------------------------------
Choose a Strategy, Develop a Plan and Follow a Process
Arthur Hill, CMT
Chief Technical Strategist, TrendInvestorPro.com
Author, Define the Trend and Trade the Trend
Want to stay up to date with Arthur's latest market insights?
– Follow @ArthurHill on Twitter


