The British Pound ($XBP) is one of the world's most prominent currencies. With all the turbulence around the Scottish referendum only 2 months away, I might expect more weakness. I was pretty young when Quebec held a vote for separation from Canada in May 1980, but it embroiled the country for a long time. Investors were reluctant to invest in Quebec and in Canada. The British Pound charts look unaffected by the separation turbulence. Here is the long term weekly. The RSI has broken above the bear market level of 60, and looks very strong. Now, the price action is at the long term centre of the 30 year range. It is also a significant resistance level. In late 2003 the price broke above the 170 level and stayed there until late 2007. It would generally appear that the Pound has most of the historic price action below the 170 level.
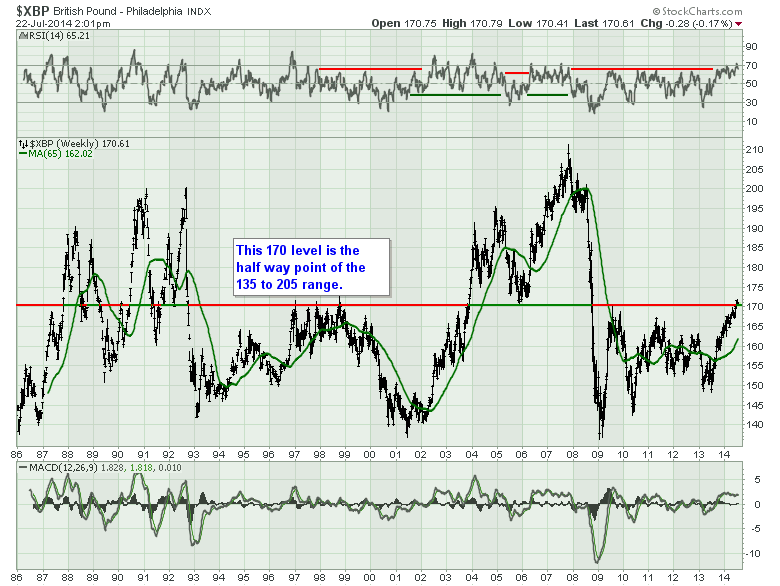
Now that the price has reached this level, there is nothing showing it is about to stop. The historical area suggests we might pause here before moving higher. The MACD is showing a very strong push on the MACD and until we see some volatility enter the trend, this looks to continue higher.
Now zooming in on the weekly, the pound continues to climb. We can see it nudged above resistance and sits right at the 170.60 level at time of writing. The RSI has been in bull mode for almost a year. The Pound continues to look healthy on the chart by any standard.
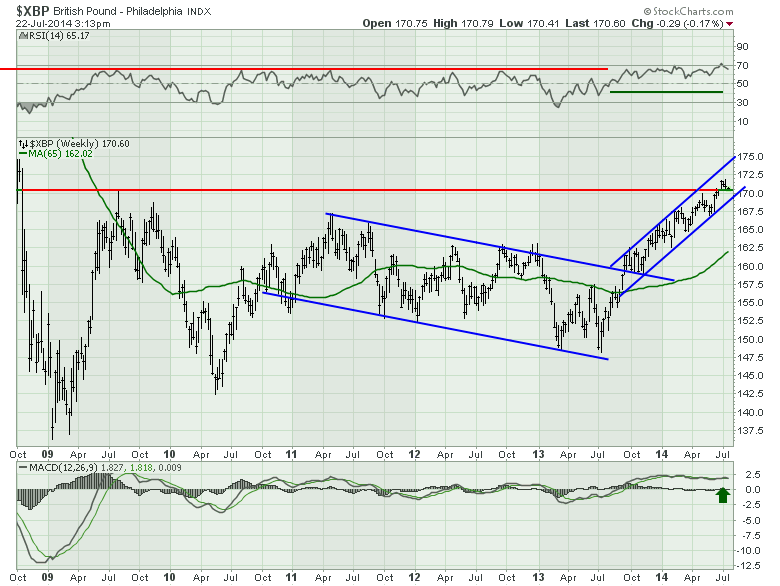
Look at the MACD just maintaining a nice high posture. The only reason to expect any change in trend would be the long term resistance.
Onto the daily... Well, this doesn't need much analysis. The RSI is in bull mode. The Moving averages have smooth up sloping trend lines. The price is moving in the channel, the blue trend line holds up. If you were hunting for a negative, it would be that the price has not challenged the upper channel line since early March.
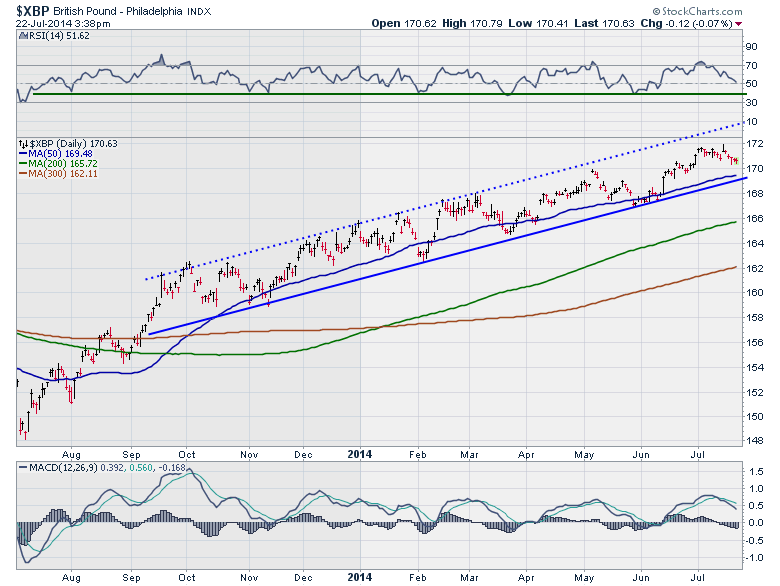
The MACD looks very normal, and continues to stay above zero. This daily chart is a great starting point for a new technician. We have an uptrend, we are in an uptrend and until we start to see some volatility or trend line violations, the trend is up.
If you missed any of the other currency articles, they can be found on The Canadian Technician Blog page. Click on this link to get there. The Canadian Technician.
OK, The Swiss Franc is buried amidst the Euro countries. Let's do the Swissie next and move into the Euro for our last currency.
To Summarize where we are so far:
The Yen is trying to break out to the upside but is stuck just below the long term resistance.
The Aussie is trying to stay above a major 4 year up trend line and is trapped under the 6 year horizontal resistance.
The Loonie is trying to break back above a 4 year rounded top neckline and is currently trapped between two long term horizontal support/resistance levels.
The Swedish Krona has broken down from the 4 year up sloping trend line and this week it broke to new lows.
The British Pound is at major resistance/support but is in a nice tight uptrend.
Good trading,
Greg Schnell, CMT


