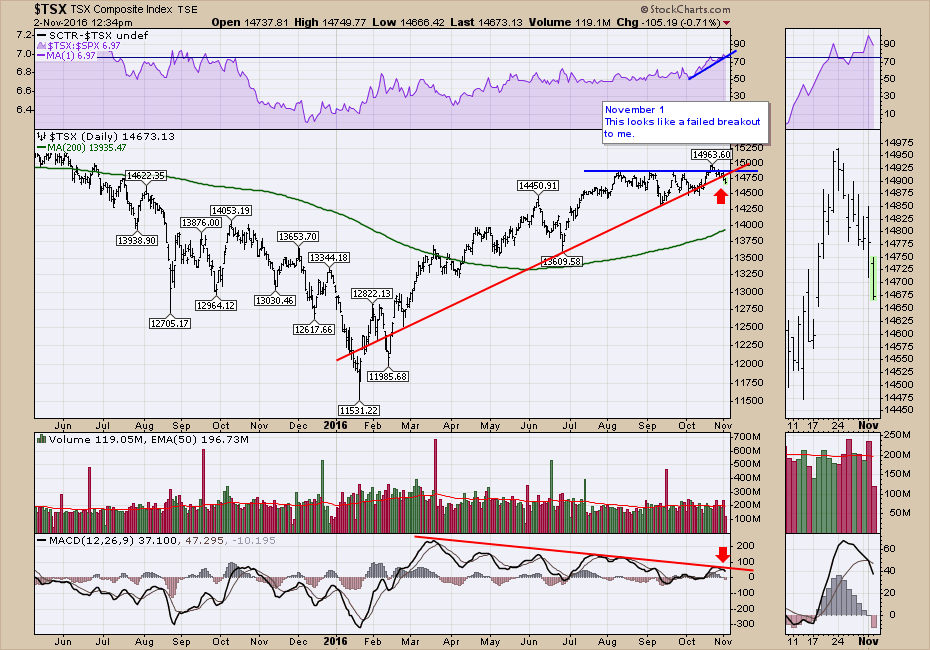
The Toronto Stock Exchange ($TSX) has some worrying technical conditions this week.
First of all, on a large 18 month chart, we appear to be breaking the trend line up. It also looks like we have a failed breakout above previous resistance. I have used the lowest slope possible to define the uptrend at this point. The MACD also gave us a sell signal today.
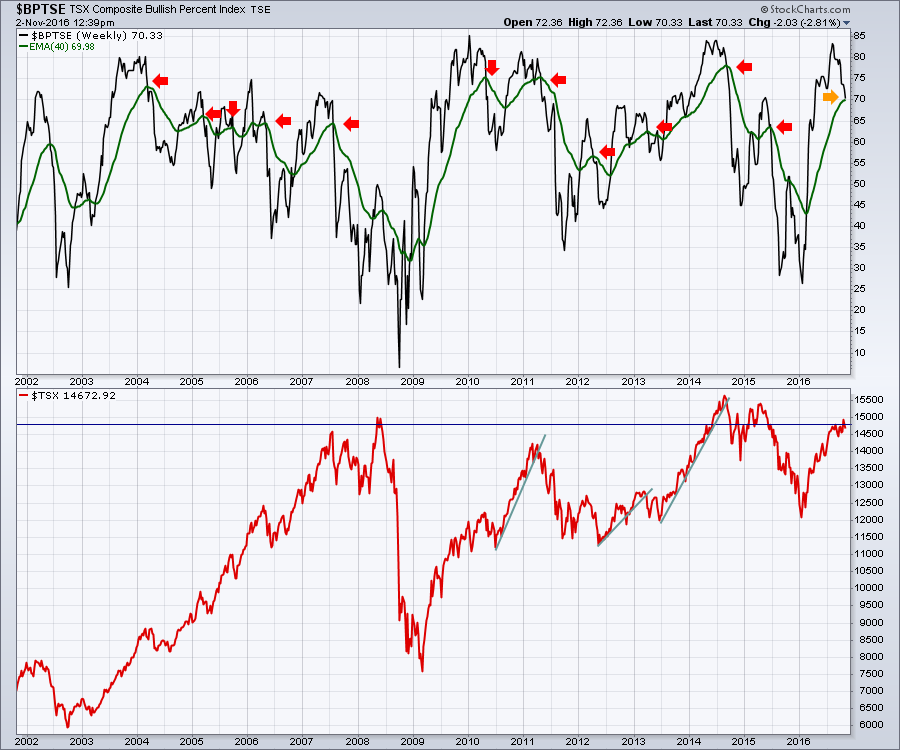
Here is a longer view of the $TSX and the Bullish Percent Index ($BPTSE). Just using a simple 40 WMA suggests the market is correcting. We have had 11 sell signals in 12 years. We are very close to another one. I did not include the sell signals from very low levels in 2002-2003 or 2008-2009.
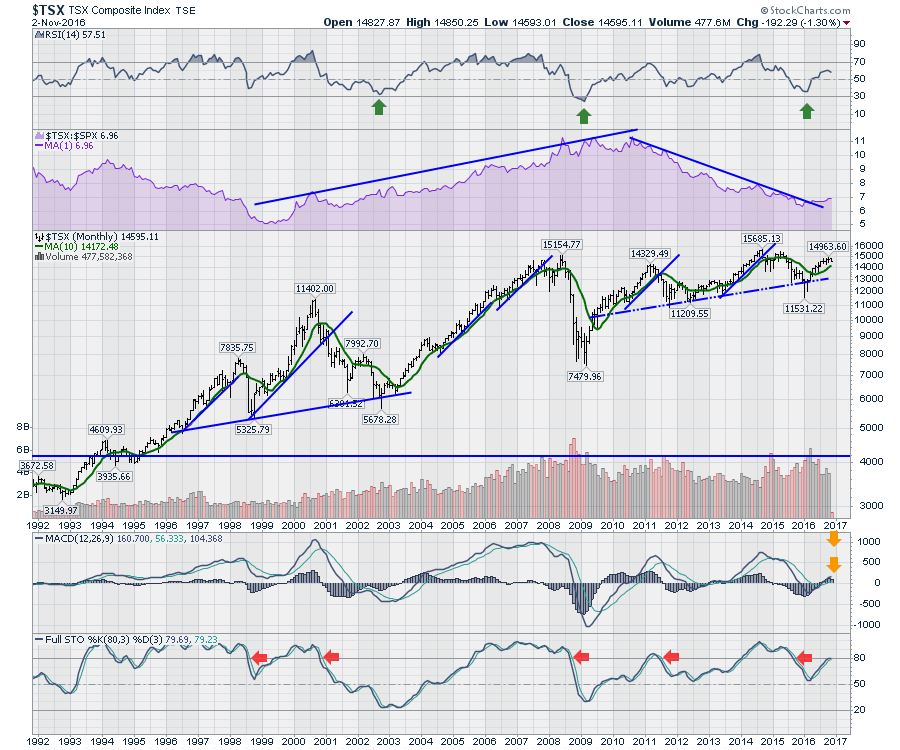
 Using the RSI and the MACD on a monthly chart, the $TSX sits at an important level. The monthly RSI appears to be rolling over to end October. I treat this like a simple warning shot. The MACD is still rising, but it is just above zero. Through November and December, we will be watching to see if it starts to roll over. Weakness so close to zero would not be a good sign. In 2012 and 2013, the central banks around the world stepped in to restart momentum. Lastly, the long term Full stochastics are hovering around the 80 level. It needs to jump well above to resume a bull market trend. A rollover here would be negative. The Full Sto is still above the signal line, but just barely.
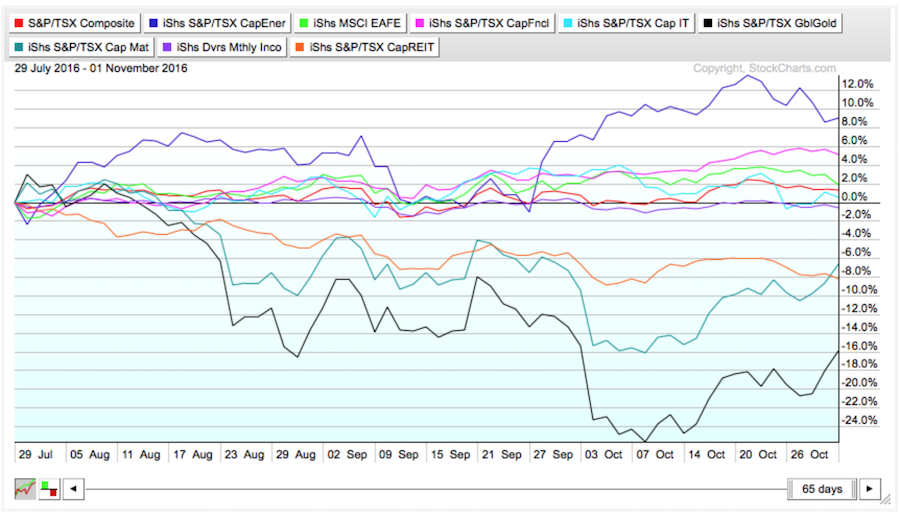
 In the last few days, Gold and Materials have rallied a little. Everything else seems to be rolling over together.
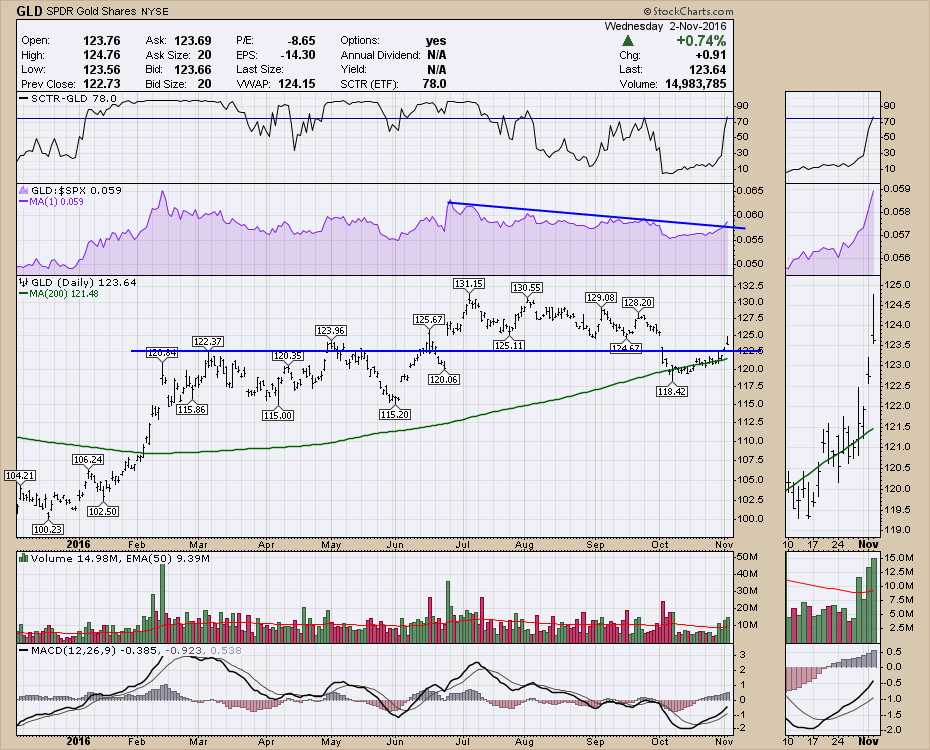
 Today had all the makings of a reversal day for Gold (GLD) which I have shown below. It gapped up on the open. Then it tested a long way higher and closed near the low of the candle, but still well above yesterday's close. This price action of testing a higher range then pulling back to make very little progress from open to close is concerning. The zoom box on the right shows the bar in detail. In the blog article yesterday for Don't Ignore This Chart I mentioned there could be significant resistance at $125. Gold Makes A One Month High.
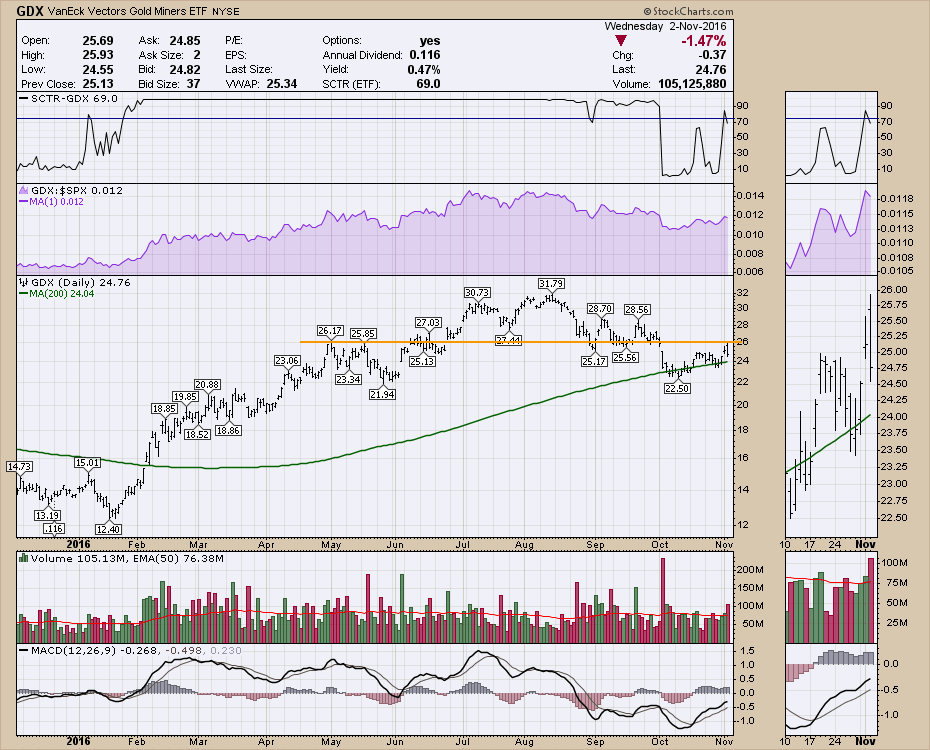
 However, the Gold miners (GDX) really looked weak today, almost confirming a gold reversal. In the Zoombox, today printed an outside reversal. This means it made a higher high and a lower low than the previous day. The action within the candle is important. First of all, the GDX gapped up continuing yesterday's price action. It pushed higher, then lost momentum. However, it did not hold this new high and proceeded to move lower, past the open. But then, GDX continued lower than yesterdays high, then yesterday's close and yesterdays low. Finally it closed below the breakout level of $25.00. That would be considered a failed breakout for me and usually means an above average move the other way or down in this case.
 I spent a lot of time on the Canadian Technicians Webinar discussing the $TSX and the $SPX to help explain the macro position for Canada and Commodities.
The Canadian Technician LIVE! with Greg Schnell - 2016-11-01 17:00 from StockCharts.com on Vimeo.
Webinar Skim // Breadth 0:00 //Oil 6:00//Currencies 7:00 // $TSX Index 11:00 // Relative Strength 20:00 // $TSX Sectors 24:00 // Bullish Percent Indexes 41:00 // Wrap up 50:00 //
For those who have been listening to the webinars for a while, we have been discussing some potential weakness for a while. It would appear it is starting to show up. With markets falling for over a week now, and the bearish setups on breadth, Chart patterns and commodities, I would be inclined to add portfolio protection. There is a broader theme globally that doesn't sit well with me on the charts.
We should bounce for a few days sometime soon, but I view that as a place to add protection as it gets less expensive during the bounce.
To answer my blog title, What's Holding The Market Up?, not much. Be very selective as the market is thin in terms of new highs.
I will be doing a Commodities Countdown Webinar 2016-11-03. I hope you'll join me live so click on that link to register. If not please visit our webinar archives to check it out later. When markets are pulling back it is harder to have positive momentum in your portfolio.
I have a group of charts that I think are important and you can look at them any time. I update the annotations over time. You can find that chartlist link here. Commodities Countdown Charts.
Lastly connect with me on Twitter @Schnellinvestor.
Good trading,
Greg Schnell, CMT, MFTA.

