ChartWatchers November 20, 2004 at 11:05 PM
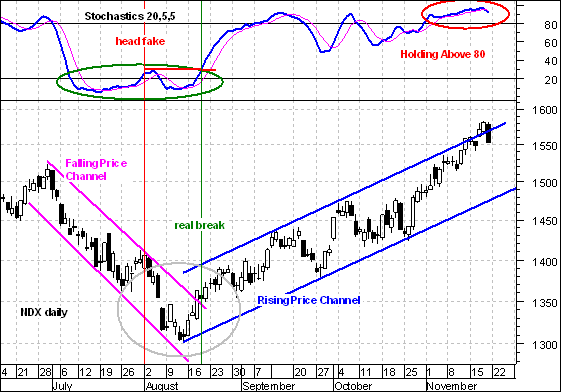
For an idea of how a FUTURE trend reversal might look, traders may wish to focus on the August low and think inverted. The July-August downtrend was defined by a falling price channel and a Stochastic Oscillator below 20... Read More
ChartWatchers November 20, 2004 at 11:04 PM
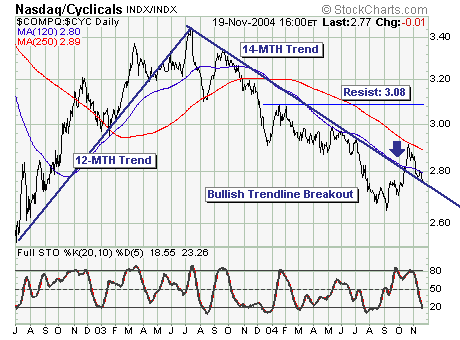
The market has finally broken out of the 2004 trading range, but many people are worried that the move could be a bull trap. One way to judge the authenticity of a move is to see how many stocks and/or sectors are participating in it... Read More
ChartWatchers November 20, 2004 at 11:03 PM
The recent rally to new highs in the S&P 500 large cap, S&P 400 mid-cap and S&P 600 small -cap is suspect. While higher prices may be offing in the near-term, we believe this rally could be terminal in nature given several divergences are evident... Read More
ChartWatchers November 20, 2004 at 11:01 PM
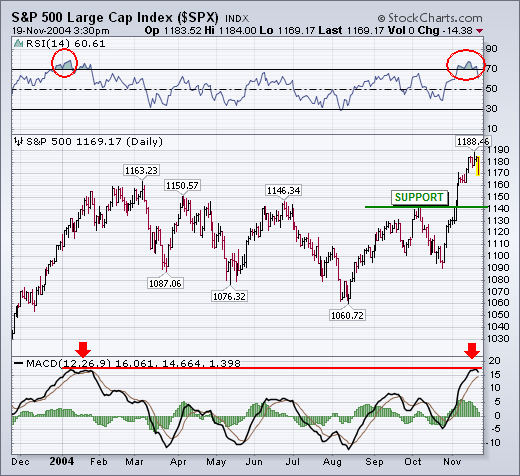
The daily chart for the S&P 500 for the last year pretty much tells the tale. The trend is still up. But its 14-day RSI line is in overbought territory for the first time since last January. Its daily MACD lines are also up against their early 2004 high... Read More
ChartWatchers November 20, 2004 at 11:00 PM
Law #11: KEEP LEARNING Law #11: Technical analysis is a skill that improves with experience and study. Always be a student and keep learning. - John Murphy This may be THE most important law of all... Read More
ChartWatchers November 06, 2004 at 11:05 PM
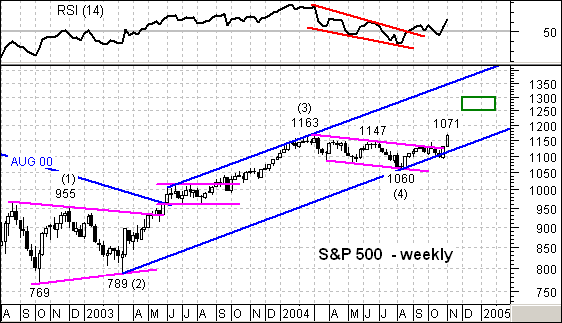
For once, the S&P 500 is stronger than the Nasdaq 100 as the index has already broken above its 2004 high (1163). The overall pattern looks like an Elliott 5-Wave advance and the 2004 decline formed Wave 4... Read More
ChartWatchers November 06, 2004 at 11:04 PM
While it is widely reported when a stock is hitting a new 52-week high or low, I've always been curious as to where stocks are in relation to their 52-week range the rest of the time. To determine this I developed the "Rel to 52" scale... Read More
ChartWatchers November 06, 2004 at 11:03 PM
Two weeks prior, a major bullish key reversal' higher developed in the S&P 500 Index; this led to Friday's new relative high. Given this, proper sector' positions are required to take full advantage of racing with the strongest'... Read More
ChartWatchers November 06, 2004 at 11:02 PM
IS THERE A GAP IN YOUR ANALYSIS? - A new article has been added to ChartSchool that covers the four main gaps and what they mean. Click Here to view the article. Give us feedback on what you think of this article about gaps... Read More
ChartWatchers November 06, 2004 at 11:00 PM
Nothing helps the markets like a lack of uncertainty. With the election resolved quickly, a big relief rally got underway on Wall Street with the Materials, Energy and Consumer Staples sectors posting the biggest gains... Read More