ChartWatchers September 18, 2011 at 02:09 AM
Hello Fellow ChartWatchers! With headlines like "Rally in Trouble?", "Start of Correction?" and "VIX Stalls" you'd think that our technical analysts were trying to tell you something..... Read More
ChartWatchers September 17, 2011 at 05:00 PM
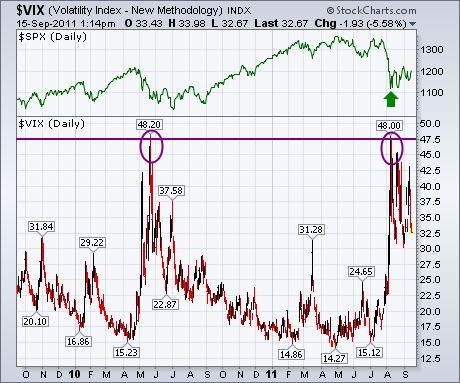
Two Thursdays ago (September 1) I wrote about the CBOE Volatility (VIX) having reached previous resistance formed during the spring of 2010 near 48... Read More
ChartWatchers September 17, 2011 at 04:57 PM
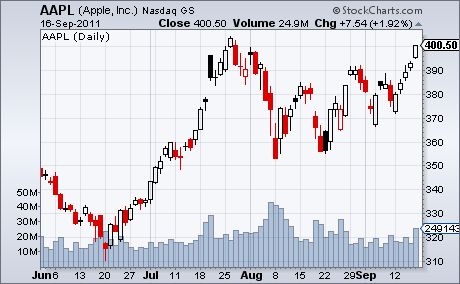
I'm not buying this rally - not yet anyway. This past Sunday night, I calculated max pain for the ETFs that track our major indices. After staring at the numbers, I wondered "can they do it again"? By "they", I meant the market makers... Read More
ChartWatchers September 17, 2011 at 04:53 PM
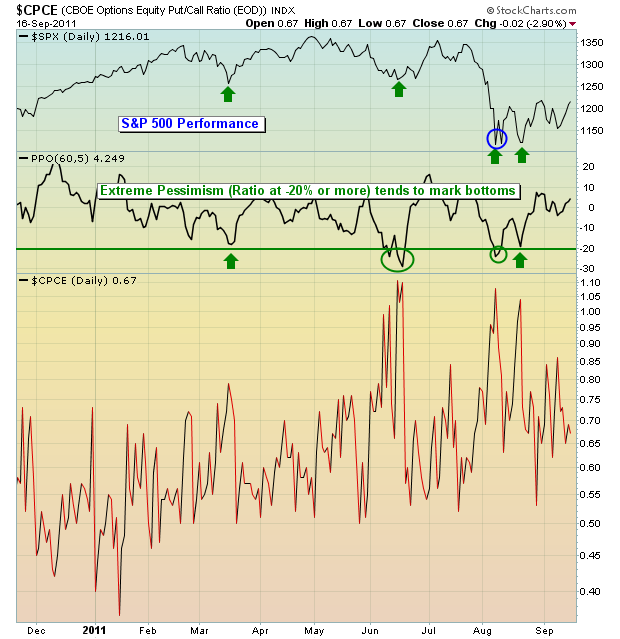
Over the past 6-weeks, we've seen the S&P 500 trade in a large sideways pattern between 1220 and 1100; we find this eerily reminiscent of a bearish pattern that will resolve itself to new lows... Read More
ChartWatchers September 17, 2011 at 04:50 PM
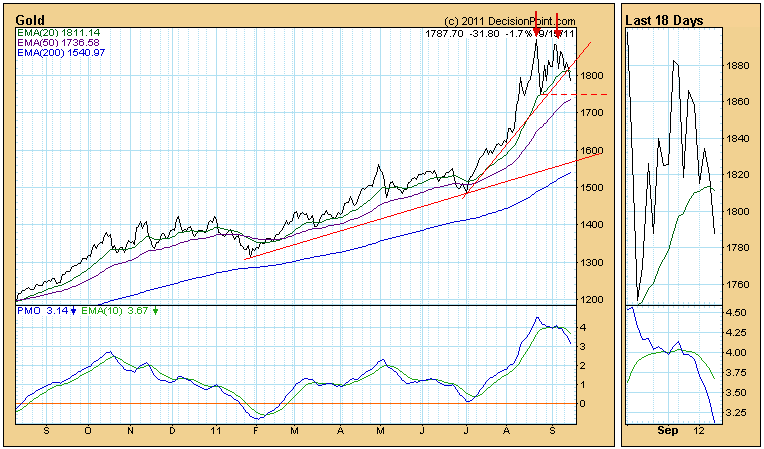
In the last month or so gold has formed a double top that could be the start of a much needed correction for the metal. Specifically the chart below shows an Adam & Eve double top... Read More
ChartWatchers September 17, 2011 at 07:00 AM
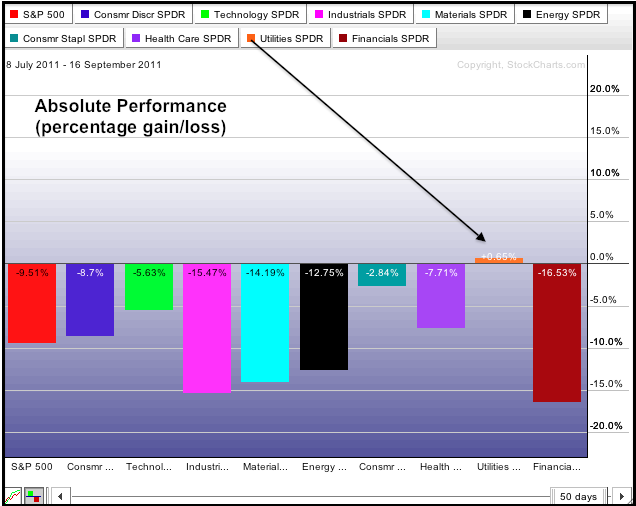
The S&P 500 peaked in early July and declined sharply into early August. There has been a rebound from this low, but all sectors are still down since July 8th – except one. The Utilities SPDR (XLU) is the only sector SPDR showing a gain since July 8th... Read More
ChartWatchers September 04, 2011 at 02:49 PM
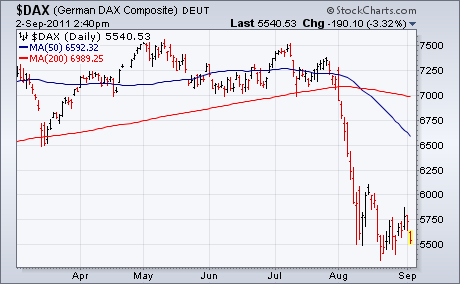
EUROPEAN STOCKS FALL ... This morning's weak employment report is having a negative impact on global stock markets. European stocks are down 3%. Chart 1 shows the German DAXto be the weakest of the three after having achieved a feeble rally over the last month... Read More
ChartWatchers September 04, 2011 at 02:45 PM
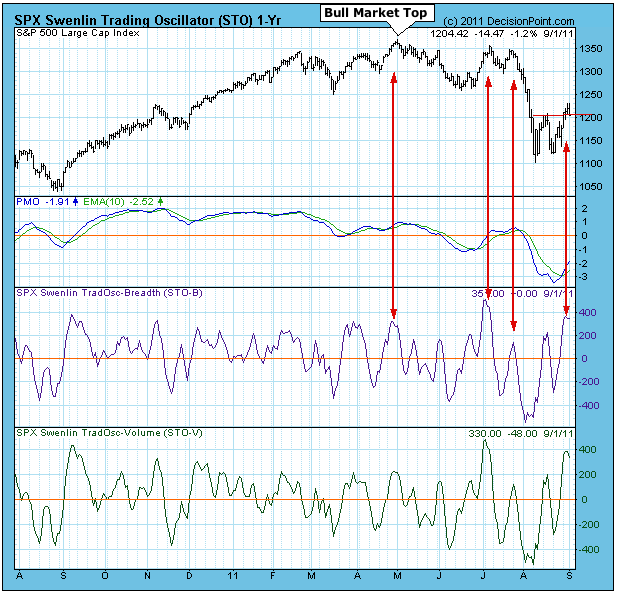
It is a concept that we stress on a periodic basis, and we got another illustration this week. Technical indicators must be interpreted within the context of the overall market trend... Read More
ChartWatchers September 04, 2011 at 02:41 PM
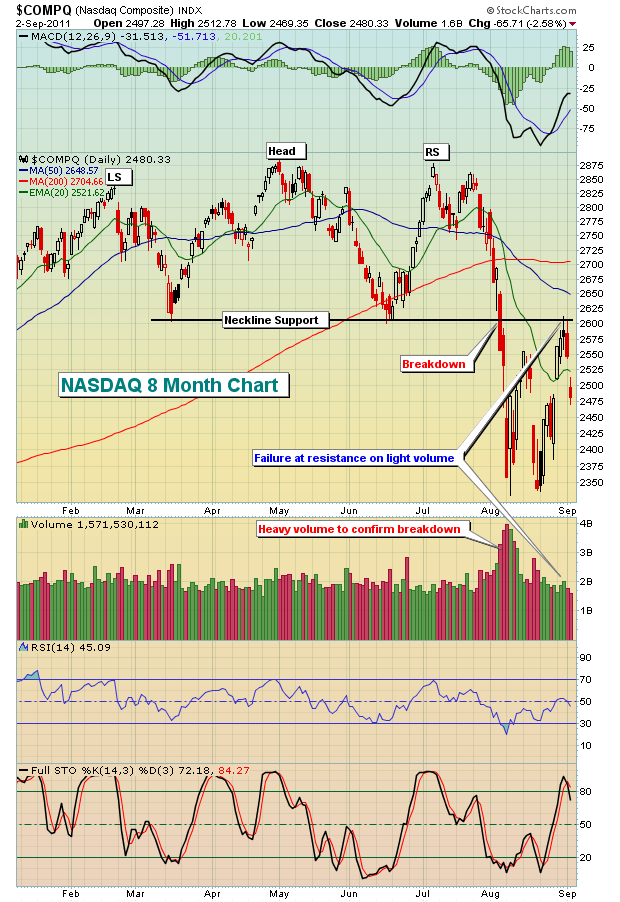
Wednesday at noon, the Dow Jones and NASDAQ were both testing critical resistance. Here's an excerpt from my daily Market Chatter mailed out close to noon EST on Wednesday: "We certainly don't like the action thus far today... Read More
ChartWatchers September 03, 2011 at 07:26 PM
Hello Fellow ChartWatchers! Last month, we announced the opening of a new User-to-User help website called "s.c.a.n." - the StockCharts Answer Network. Hopefully, you've had a chance to check it out - if not, I strongly encourage you to do so. s.c.a.n... Read More
ChartWatchers September 03, 2011 at 07:19 AM
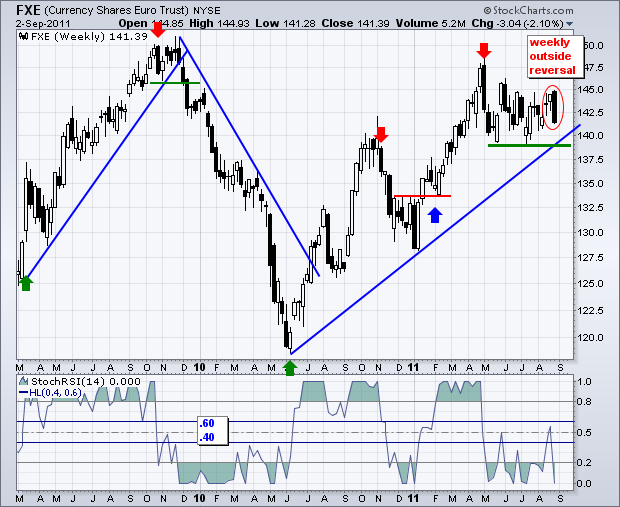
The Euro Currency Trust (FXE) opened strong on Monday, but moved lower throughout the week and closed near its low for forge an outside reversal. An outside reversal occurs when the high is above the prior high and the low is below the prior low... Read More