ChartWatchers April 22, 2012 at 02:46 PM
Hello Fellow ChartWatchers! Spring has finally sprung here in the Pacific Northwest and we are very glad that it has. I hope the weather is as nice where you are as it is here. This edition of ChartWatchers contains some great articles - not all of them quite so sunny... Read More
ChartWatchers April 21, 2012 at 05:28 PM
WELCOME GATIS ROZE AND "THE TRADING JOURNAL" BLOG - In case you missed it, we've added another great author to our collection. Gatis Roze is not writing articles in our free Blogs area for "The Trading Journal" blog... Read More
ChartWatchers April 21, 2012 at 04:44 PM
Once a month, the stock market provides us a unique opportunity. In basketball terms, it's like the market makers have the ball with time running out in the quarter - or the game - and they nearly always bury that critical three-pointer... Read More
ChartWatchers April 21, 2012 at 03:52 PM
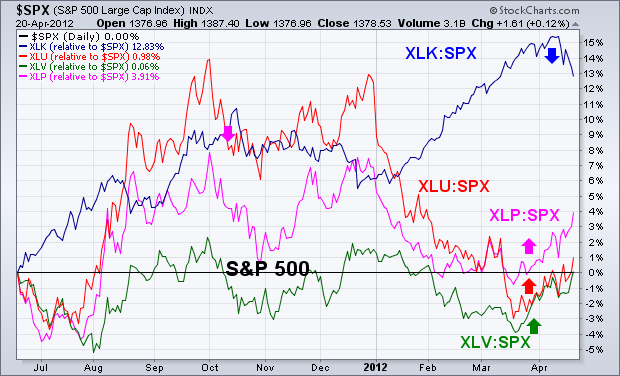
One of the ways to measure the mood of the stock market is to see what sector rotations are taking place beneath the surface. Chart 1 shows that sector rotations over the past month reflect a market mood that is turning more defensive... Read More
ChartWatchers April 21, 2012 at 03:49 PM
A subscriber brought something to my attention that I wish I had thought of before. We think (at least I did) that the SPY (ETF) and SPX (S&P 500 Index) perform pretty much the same except for some minor tracking error... Read More
ChartWatchers April 21, 2012 at 06:04 AM
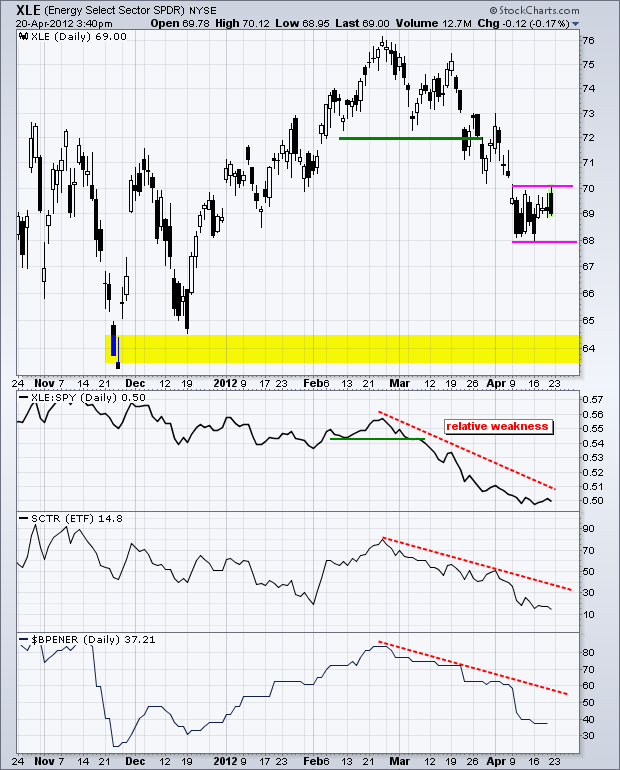
The Energy SPDR (XLE) broke key support in late March with a sharp decline and has yet to reach the next key support level. The chart below shows XLE consolidating in the 69 area over the last two weeks. This consolidation looks like a rest within the downtrend... Read More
ChartWatchers April 07, 2012 at 07:28 PM
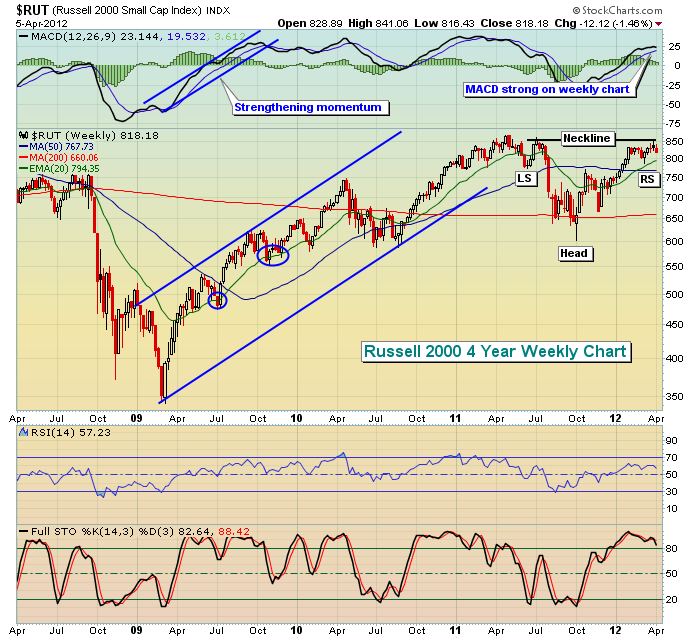
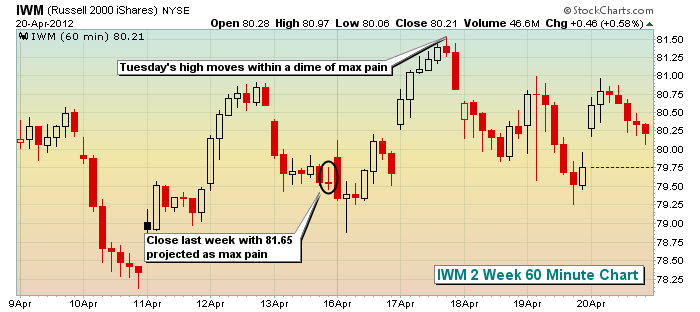
I'm not quite sure why, but there definitely is a positive bias towards small cap stocks as we approach the Spring season. April and May are the 2nd and 3rd best calendar months in terms of annualized returns on the Russell 2000... Read More
ChartWatchers April 07, 2012 at 07:23 PM
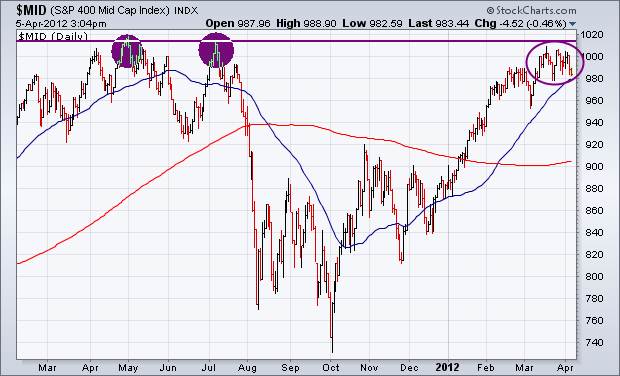
Although I generally look at the S&P 500 to get a feel for the market's trend, it's a good idea to see what other stock indexes are doing. Two of them are giving warning signals. Chart 1 shows the S&P 400 Mid Cap Index (MID) starting to meet resistance along its 2011 highs... Read More
ChartWatchers April 07, 2012 at 04:00 PM
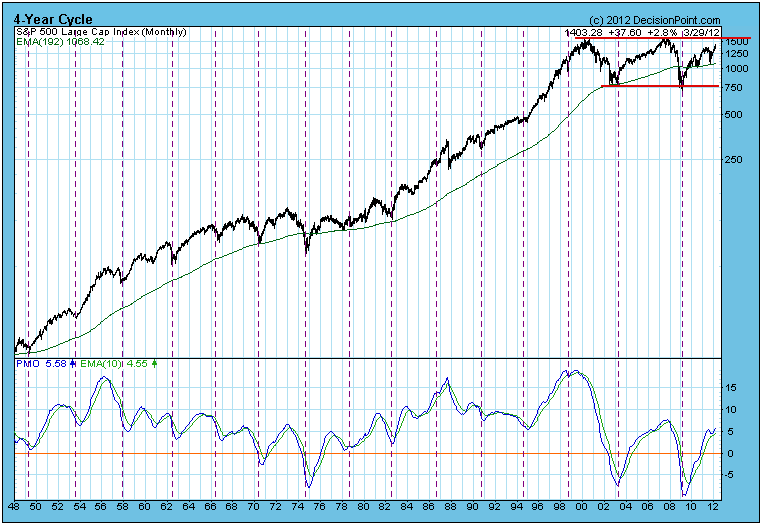
We don't look at the 4-Year Cycle chart very often, but a subscriber's comments reminded me that now would be an excellent time to view the progress of this important cycle. On the chart below the vertical lines show the location of all nominal 4-Year Cycle troughs since 1948... Read More
ChartWatchers April 07, 2012 at 02:12 PM
Hello Fellow ChartWatchers! Having the right subscription level can save you a significant amount of money OR depending on how you use it, it can cost you a lot of money in the form of bad trades... Read More
ChartWatchers April 06, 2012 at 11:21 AM
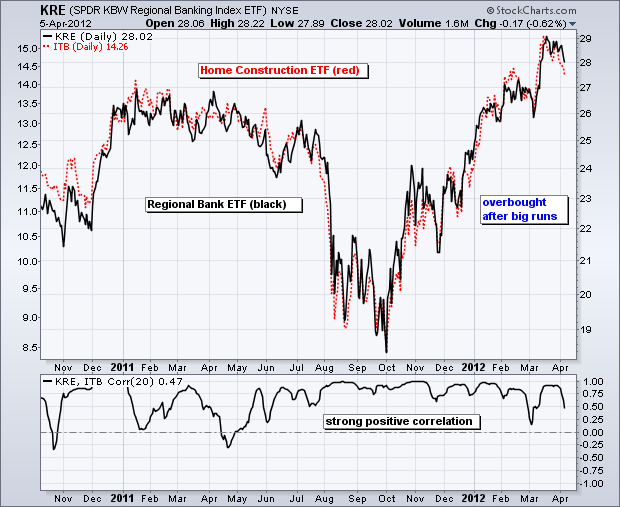
The Regional Bank SPDR (KRE) and the Home Construction iShares (ITB) have led the market higher since October. ITB is up over 50% since early October and KRE is up over 40%. The chart below shows ITB in black and KRE in red... Read More