Hello Fellow ChartWatchers!
Three consecutive down days at the end of the week confirmed that August is going to be a rough month for stocks. A couple of quick clicks on our Interactive PerfChart tool show that all of the major market averages moved lower this week by between 1.6% (Nasdaq) and 2.30% (Russell 2000). A couple more clicks on our S&P Sector PerfChart show that Utilities was the weakest sector losing over 4% for the week while Technology stocks got the week's "Least Terrible" award for only losing 0.5%.
(For those of you following along at home, be sure to un-click the "S&P 500" button at the top of the Sector PerfChart to get absolute readings.)
Our Major Markets CandleGlance page provides another view of the damage with both the Dow and the S&P 500 finishing below their 50-day moving averages on Friday.
So what's doing well right now? How about HOG? Harley-Davidson is racing up our SCTR rankings thanks to a strong rebound on Friday. WPX Energy did even better.
"Stealing" Arthur Hill's Market Analysis Routine
OK, so I've just led you on a "tour" of my routine for understanding the market and finding interesting stocks to look at. It's pretty simple: PerfCharts -> CandleGlance -> SCTRs
The key point is that it is an easy, quick, repeatable routine that can be done consistantly every day. Finding a routine that gives you a useful picture of the market is one of the most important things you can do as a technical investor. I preach about this all the time in the SCU Seminars that I give.
If you don't have a routine that you are happy with, I have some great news for you - now you can "steal" Arthur Hill's daily routine and add it to your StockCharts account with just two clicks. That is because we've just released another free ChartPack called "Arthur Hill's Market-in-a-Nutshell."
(In case you are new to StockCharts, Arthur Hill is our Senior Technical Analyst who works with John Murphy to publish the "Market Message" area of our website. Arthur also wrote much of our ChartSchool area and appears in many of the Videos we have. Did I mention that he also writes many of our free blog articles including one lower down in this newsletter? Art's awesome.)
(Oh, and if you haven't heard about them already, click here to learn more about ChartPacks. Members can install Art's ChartPack by clicking on the "Your Account" link at the top of any page and scrolling down to the "ChartPacks" section of that page.)
The "Nutshell" ChartPack contains the 10 charts that Arthur reviews every morning before the market opens. They give him a complete picture of where things are currently and where they may be headed.
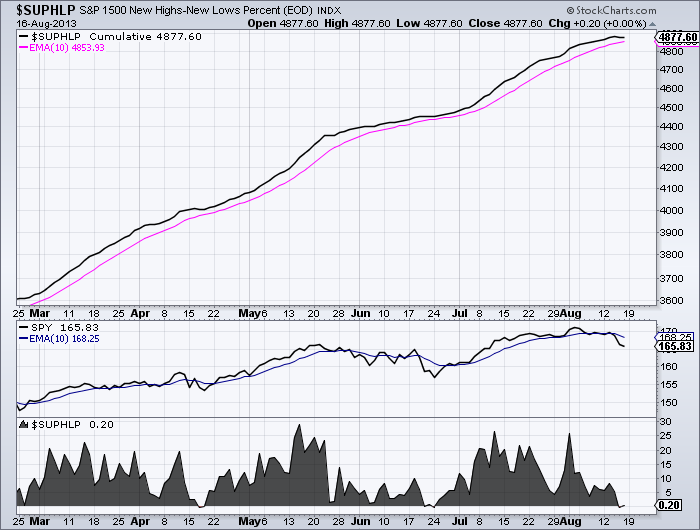
And of the 10 charts that Arthur considers essential for understanding the market, here is the most essential - the creme of the crop. (And I bet you've never heard of the ticker symbol before now!)
Presenting... $SUPHLP! (Wait, what?)
Click on the chart to see a live version.
$SUPHLP is the "Percentage High-Low Line" for the stocks in the S&P 1500. It's the number of S&P 1500 stocks making new 52-week highs minus the number of stocks making new 52-week lows divided by 1500). This chart plots that percentage as a black cumulative line with a pink 10-period EMA signal line.
To quote Art:
The market has a bullish bias when the High-Low Line is above its 10-day EMA (rising) and a bearish bias when below (falling).
Below the main price plot is SPY, the S&P 500 ETF, and its 10-period EMA. Below that is the non-cumulative version of $SUPHLP plotted as an area graph. Note that it dipped briefly into negative territory on Thursday. The question now is how long will it stay at or below zero in the coming days?
The reason this chart is so important is because the S&P 1500 is an extremely broad index and if it is weakening internally (as measured by the High-Low Line) then you should be cautious. Make sense?
So there is a great chart for you to build into your own market analysis routine. If you want the rest of Arthur's key charts (and you are an Extra member), just install the "Nutshell" ChartPack using the yellow button near the bottom of the "Your Account" page. After installation, click on the "Members" tab, scroll down and click on the "10 per page" link beside Art's list. You'll see the charts and Art's notes that fully explain each chart.
Take care everyone!
- Chip


