|
|
The classic head-and-shoulders is a bearish reversal pattern that marks a top. There are also inverse head-and-shoulders patterns and continuation head-and-shoulders patterns, but this article will simply focus on the bearish reversal version. As a bearish reversal pattern, an uptrend or extended advance is a prerequisite. You cannot reverse an uptrend if there is no uptrend to start with!
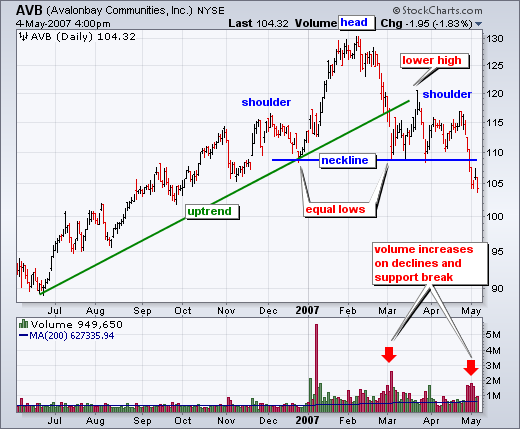
There are four components to the head-and-shoulders pattern: the left shoulder, the head, the right shoulder and the neckline. The uptrend is in full swing as the left shoulder and head form (higher high). Now the trouble starts. The decline from the head high returns all the way to the left shoulder low. This is the first clue that selling pressure is increasing. Lows should continually rise in an uptrend (higher lows). An equal low shows a modest increase in selling pressure. After forming roughly equal lows, a rally evolves and peaks below the low of the head to form the right shoulder. This lower high is the first clue that buying pressure is decreasing. Buying pressure was not strong enough to push prices back to their prior high (head). Ideally, the peak of the right shoulder should occur near the peak of the left shoulder to create symmetry in the pattern. In reality, emotionally driven markets do not always oblige. In fact, perfect patterns are the exception rather than the norm.
With the equal low showing an increase in selling pressure and the lower high showing a decrease in buying pressure, the head-and-shoulders top has formed. We can now draw a line from the lows to define neckline support. Even though the pattern is clearly present, it is not confirmed until there is a break below neckline support. Once confirmed with said break, the reversal is confirmed and further weakness is expected. Using traditional technical analysis, the height of the pattern is subtracted from the neckline break for a downside target. Take these targets with a grain of salt. A trend reversal has occurred and it remains in effect until proven otherwise.
Volume is also something to consider when validating a head-and-shoulders reversal. For a bearish reversal, we should see lower volume on the advances. This means volume should decrease on the rallies that form the head and the right shoulder, especially the right shoulder. In addition, an increase in volume on the declines would further validate the pattern. The S&P 500 ETF (SPY) and the Dow Diamonds (DIA) both have head-and-shoulders reversal patterns right now.


