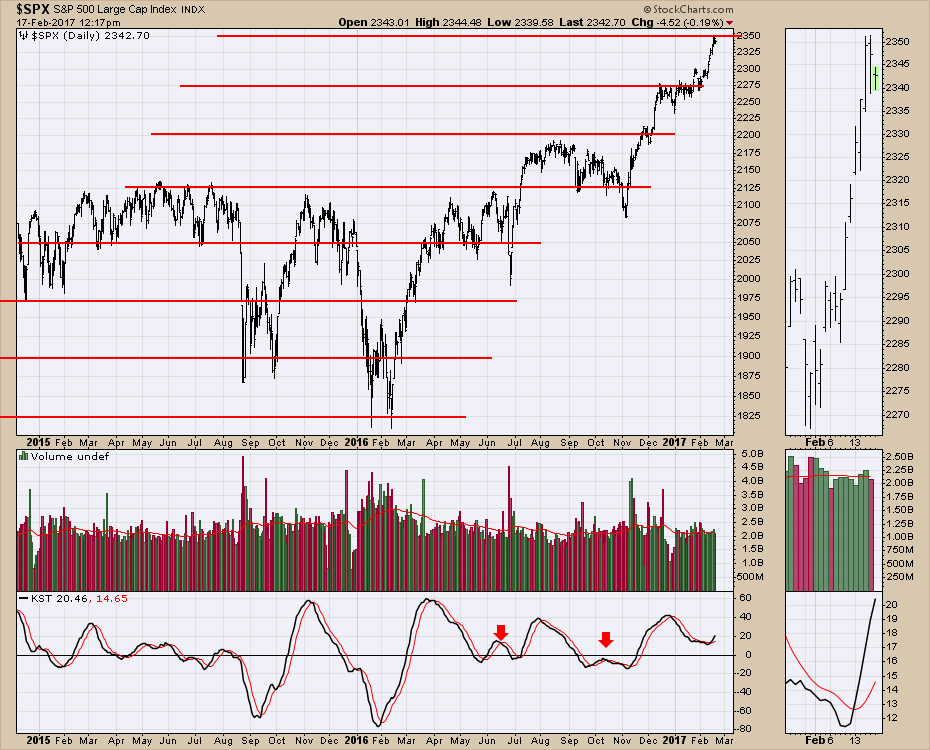
The $SPX has had a nice ladder effect going on recently. Much like the origins of technical analysis found in the early days, the market tends to move forward in ranges. These areas have been quite obvious recently. The range been support levels appears to be about 75 points on the $SPX.
Here is a copy of the chart I showed on The Commodities Countdown Webinar 2017-02-16.
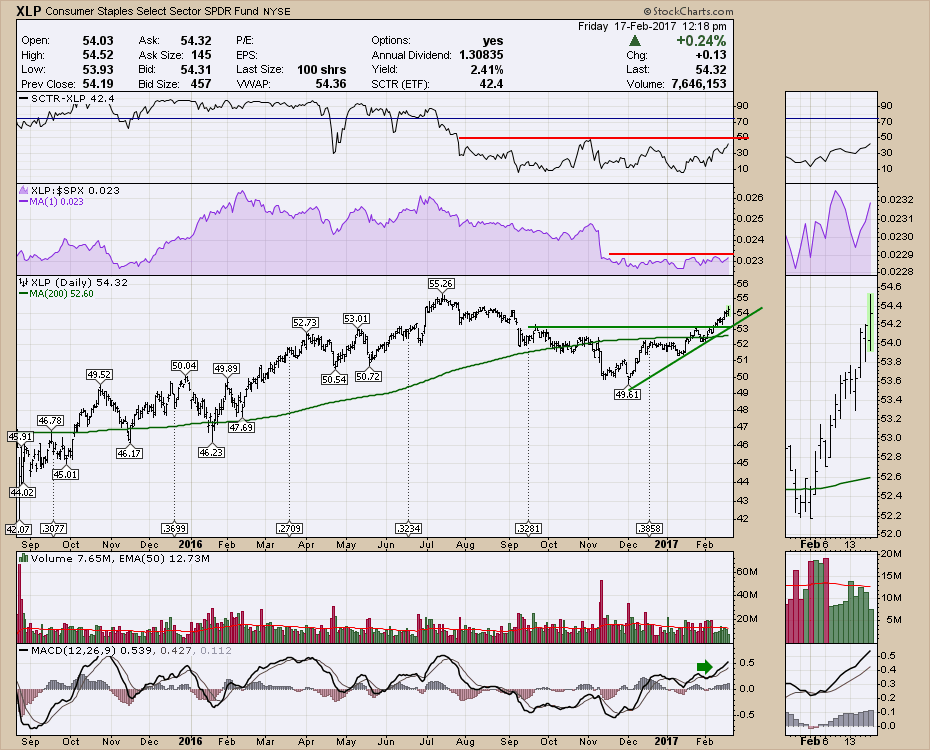
While all the world is focused on the tremendous bull run, there is a pick up in the defensive sector charts and they have started to join the rally. While this is not bearish at all, it gives us a reason to watch to see if these defensive sectors start to outperform other parts of the market. As long as the defensive sectors are underperforming the market, the growth sectors will continue.
 I talked about the leadership stocks NVDA, MU, and TECK on the Commodities Countdown Webinar 2017-02-16. These leadership stocks are starting to change their momentum on the MACD. I reviewed this on the webinar.
I also published a few important educational methodologies within some recent articles on StockCharts.com. Feel free to scan through the articles and learn more about some of the features StockCharts.com has to help their members succeed in analyzing the market.
- How to find and use the SCTR.
- SharpCharts Voyeur.
- Performance Charts.
- Custom CandleGlance Charts.
- Interpreting The Weekly RSI Indicator.
- Parabolic Price Patterns and Chandelier Stops in Video format.
- Predefined Scan Results.
If you would like to use all these tools to their maximum potential, click here to learn about becoming a member at StockCharts.com. There is more than one reason that thousands of people find this a great site for enjoying all the tools and commentary. You'll enjoy a free month trial as well!
Good trading,
Greg Schnell, CMT, MFTA.


