At one of the CMT Association meetings in NYC, I was given an interesting tip about the markets. The tip was that bank charts hold clues because bankers see everyone else's business success from the financial side. From this, it's never a bad idea to keep track of what the banks are doing. The reason I want to write about the bank charts this week is that multiple charts are at an important inflection point. This suggests the view is broader than one bank. We also have a Fed meeting in a couple of weeks which is widely expected to raise rates one more time. If the banks were going to start surging on the back of higher rates, they should probably be watched for a nice trade entry.
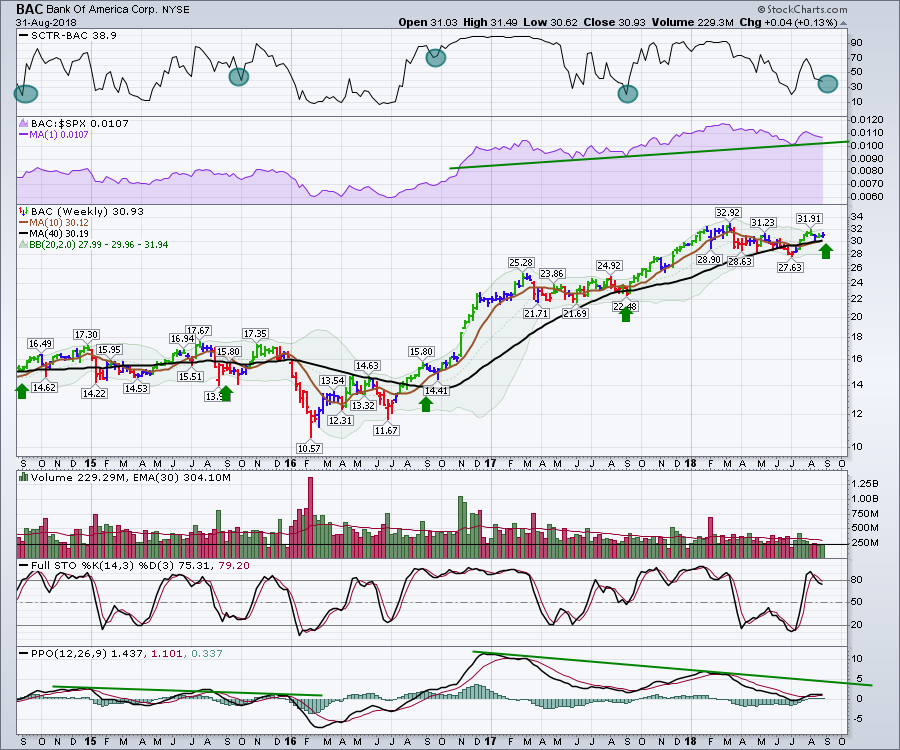
Let's start with Bank of America. It is a little odd that BAC could not follow the indexes higher this week or join the rise on the $SPX for the month. BAC was just above flat (+0.16%) while the $SPX was up over 3% for the month. Looking at the SCTR rankings, BAC always seems to have a fourth quarter surge. I have marked the lows of September on the indicator.
Secondly the relative strength is still trending higher on this weekly chart. Price is only a dollar off its highs so continuing to test the highs is good. The price is also above both moving averages. Two things add caution on the chart, but are not negatives. The Full stochastic has rolled over. I discussed a Full stochastic trade closure in the article for JP Morgan yesterday as part of some wider ideas on the chart. The PPO is still positive, so that is good news. Negative PPO's on a weekly chart are usually indicative of bigger declines. We would not want to see BAC drift lower here.
Lastly, I marked the volume of this week on the BAC chart. With the exception of Thanksgiving or Christmas holiday seasons, it doesn't usually get this low. So just low volume? This low volume has shown up for all of August! Volume can be a key to trend change so that makes it worth watching here. 
So the chart is still positive but the unusually weak volume and low PPO suggest caution. It may just be the calm before the rip into the fourth quarter, but this is a good chart to watch.
BAC was a good example and if you open many of the bank charts similarities show up all over. Weak volumes, lower SCTR levels, declining relative strength.
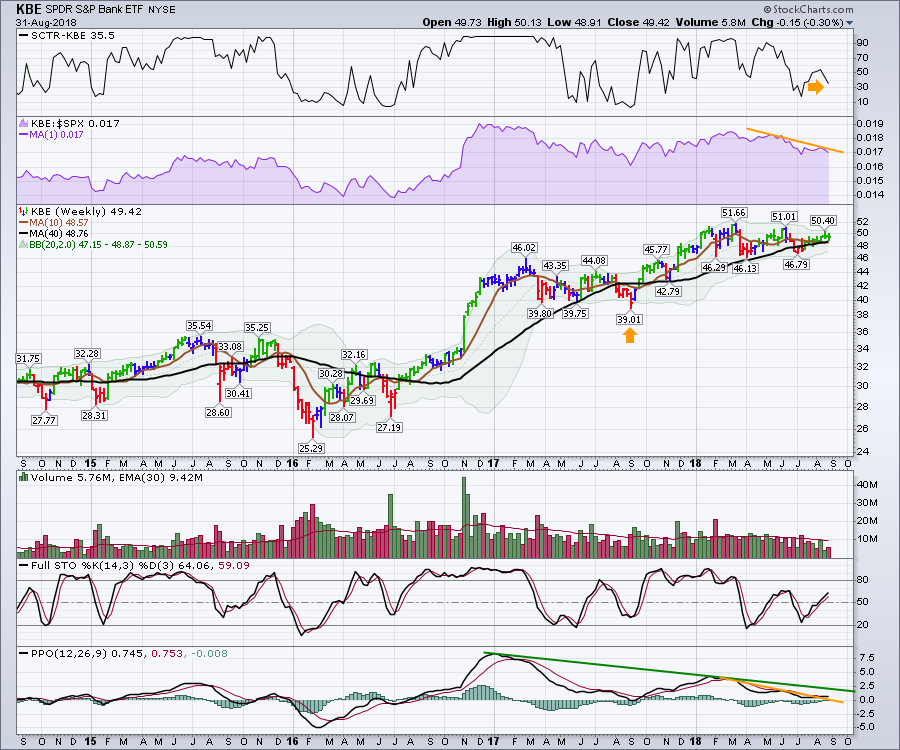
The chart below shows the KBE Bank ETF. It has similar traits. With the declining highs in price since the spring, the KBE does not look as bullish as the $SPX closing above 2800 for the week and month end close. Currently price is supported by both moving averages but the 10 week moving average has a negative slope while the 40 week has a positive slope. The volume for the last two weeks has been very light. The full stochastic oscillator is pointing higher so that is bullish.
The PPO is really important here. Sitting very close to the zero line, this is an important inflection point. A break higher above the gold trend line would suggest getting on board which it looks like it is doing now. Any break below zero with declining peaks and troughs would suggest standing down and let someone else ride the bus lower.
 So for those reasons, I think the banks are at an important inflection point. If seasonality kicks in and they get spurred on, this could be a wonderful entry. If the momentum continues to decline into a negative situation, there would probably be better places to invest your time and money.
Good trading,
Greg Schnell, CMT, MFTA.


