 Mean-reversion signals provide a great way to trade in the direction of the bigger uptrend after a pullback. The trick is to identify the bigger uptrend and then capture mean-reversion setups. Mean-reversion setups materialize after a pullback within the uptrend. The strategy is based on the assumption that prices will "revert" back to the uptrend because it is the dominant force at work. This article will show how to identify mean-reversion signals and identify the trend using one indicator.
The chart below shows Facebook (FB) with 10-day RSI. I will first show the mean-reversion signals and then show when to pay attention to these signals. First and foremost, note that I am only interested in bullish mean-reversion signals based on short-term oversold conditions. The default setting for RSI is 14 days, but this setting does not always generate oversold conditions (<30) so I increased sensitivity by setting the parameters to 10.
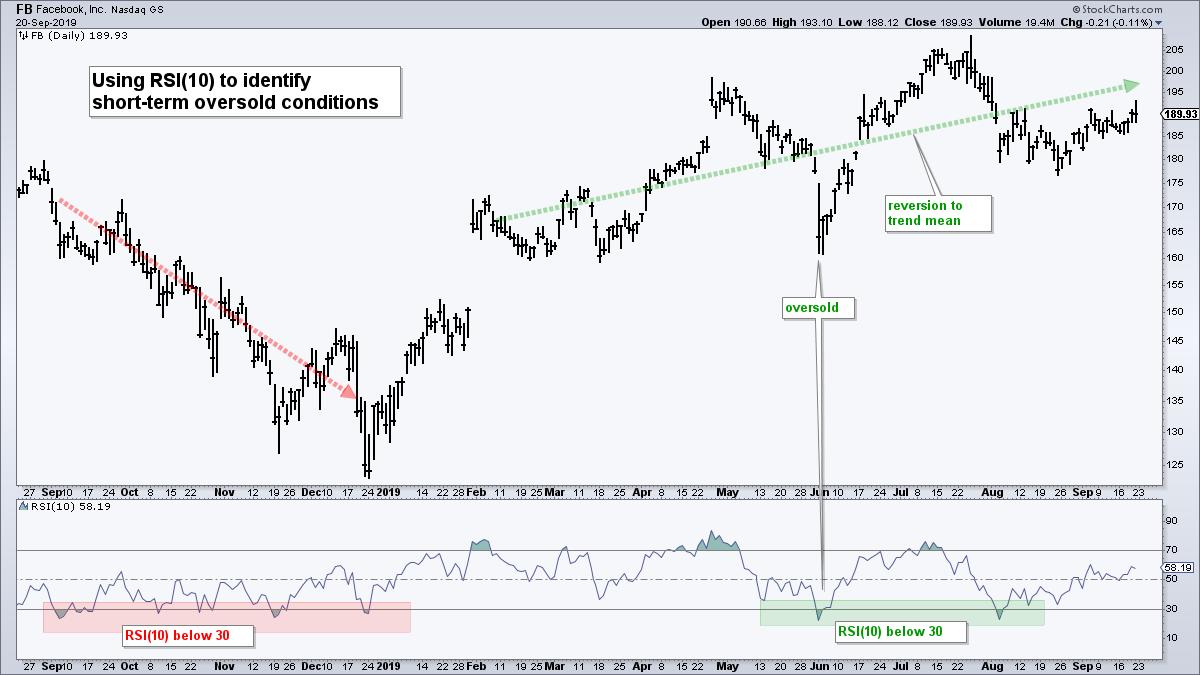
As the chart above shows, RSI(10) dipped below 30 several times over the past year. The first set of signals, from September to December 2018, triggered in a downtrend because the stock continued lower (until the big reversal in December). There were then two oversold signals in early June and early August. The stock reverted to the mean (green line) after the June signal and is in the process of a mean-reversion after the early August signal.
Links for this week's articles can be found at the end of this commentary.
The strategy is to trade in the direction of the bigger trend by avoiding oversold signals when the trend is down and considering oversold signals when the trend is up. So how do we quantify the trend? Simple. Just open the advance indicator settings on SharpCharts and add a 65-day SMA to RSI, which is around three months. The trend is down when this 65-day SMA is below 50 and up when above 50.
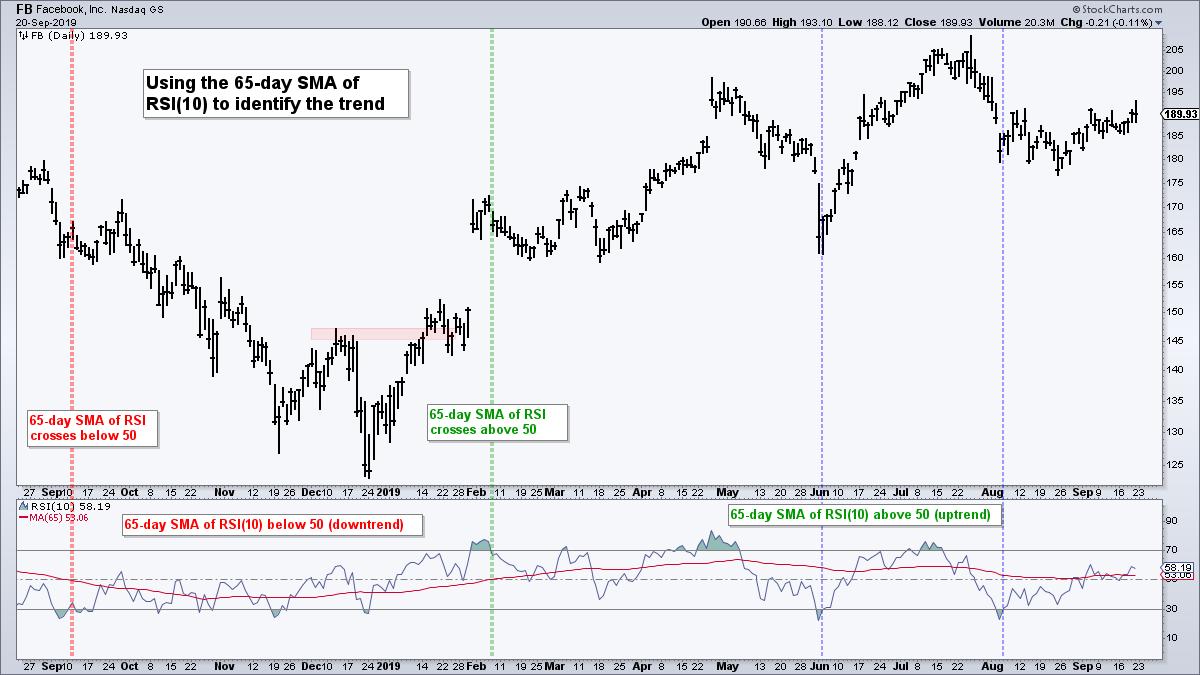
The chart above shows the 10-day SMA of RSI crossing below 50 in mid September and remaining below 50 until early February, when it crossed above 50. This SMA has been above 50 for seven months and we can confirm the uptrend just by looking at price action. Notice that Facebook has been zigzagging higher the last seven months. The blue vertical lines show when RSI(10) moved back above 30 during this uptrend and triggered a bullish mean-reversion signal.
Chartists can also combine mean-reversion signals with price analysis. Notice that Facebook was testing support when RSI(10) dipped below 30 in early June. The combination of a bigger uptrend, support test and oversold condition provided a very nice setup.
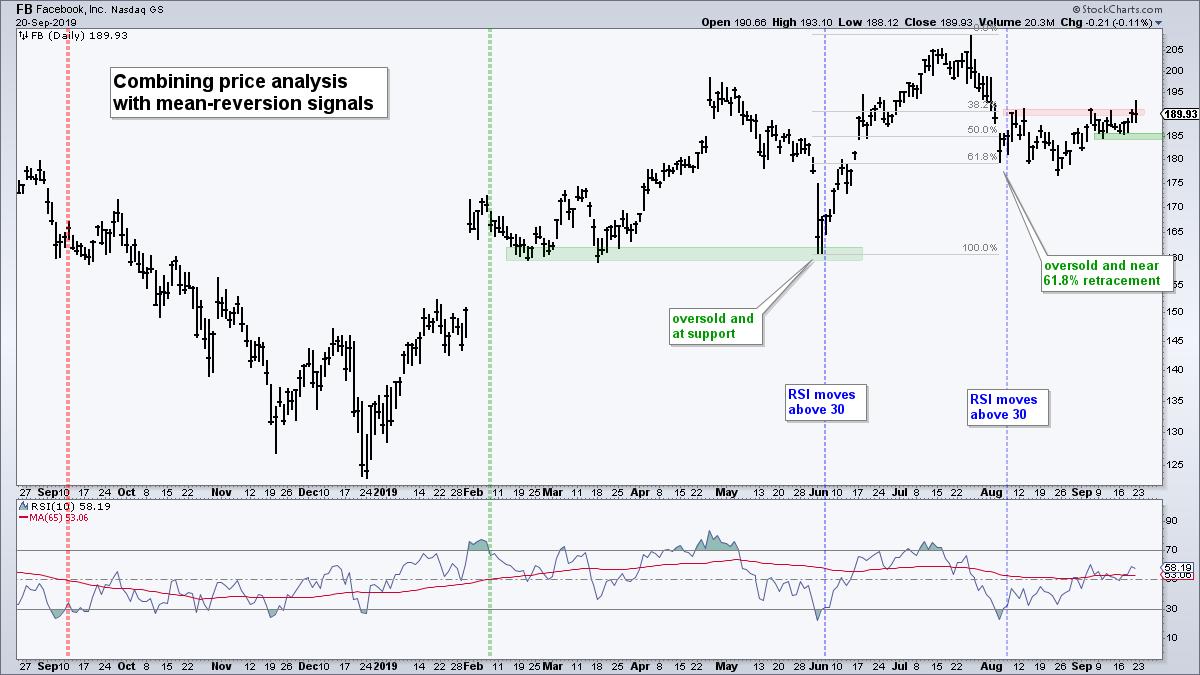
The early August signal is still open. Notice that Facebook became oversold near the 61.8% retracement in early August and bounced in mid August. However, the stock fell back below the early August low a three weeks later. These setups are not perfect and do not always call the exact low. Sometimes we need to allow a little wiggle room.
The stock bounced again over the last four weeks and is now trying to break the August highs (red zone). Overall, the short-term trend is up with the mid September lows marking support. A close below 184 would call for a re-evaluation.
-----------------------------------------------------------
This week on Art's Charts
Friday - 20-Sept: State of the Stock Market - Meet the New Leaders, Same as the Old Leaders
Thursday - 19-Sept: Ranking and Grouping Key ETFs - Tech-related ETFs Hit Moment-of-truth, while Biotech ETFs Find Support
Tuesday - 17-Sept: Moment-of-truth for Small-caps and Regional Bank ETFs
------------------------------------------------------------
Choose a Strategy, Develop a Plan and Follow a Process
Arthur Hill, CMT
Chief Technical Strategist, TrendInvestorPro.com
Author, Define the Trend and Trade the Trend
Want to stay up to date with Arthur's latest market insights?
– Follow @ArthurHill on Twitter


