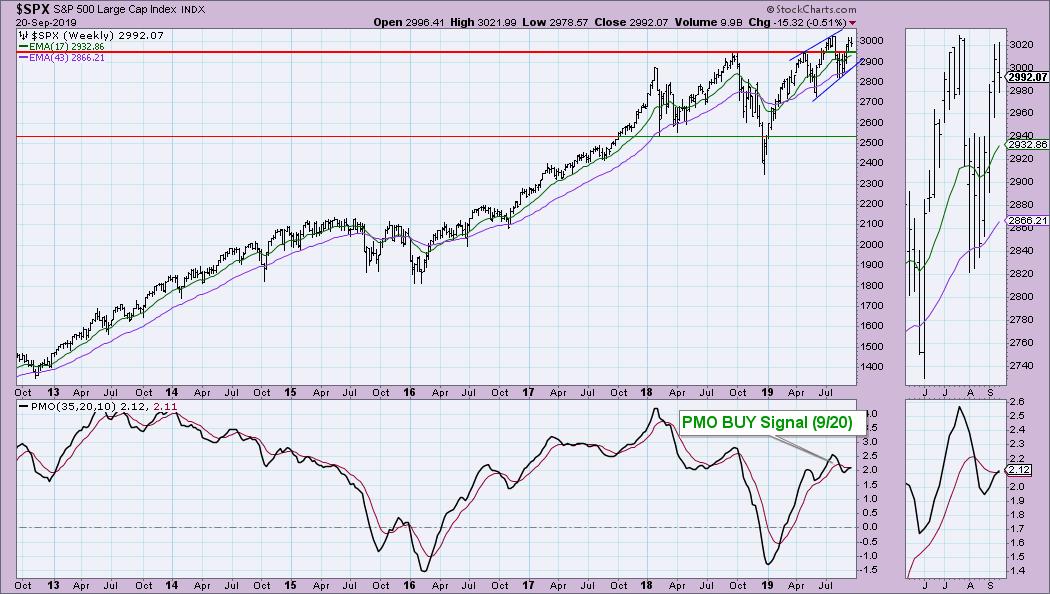
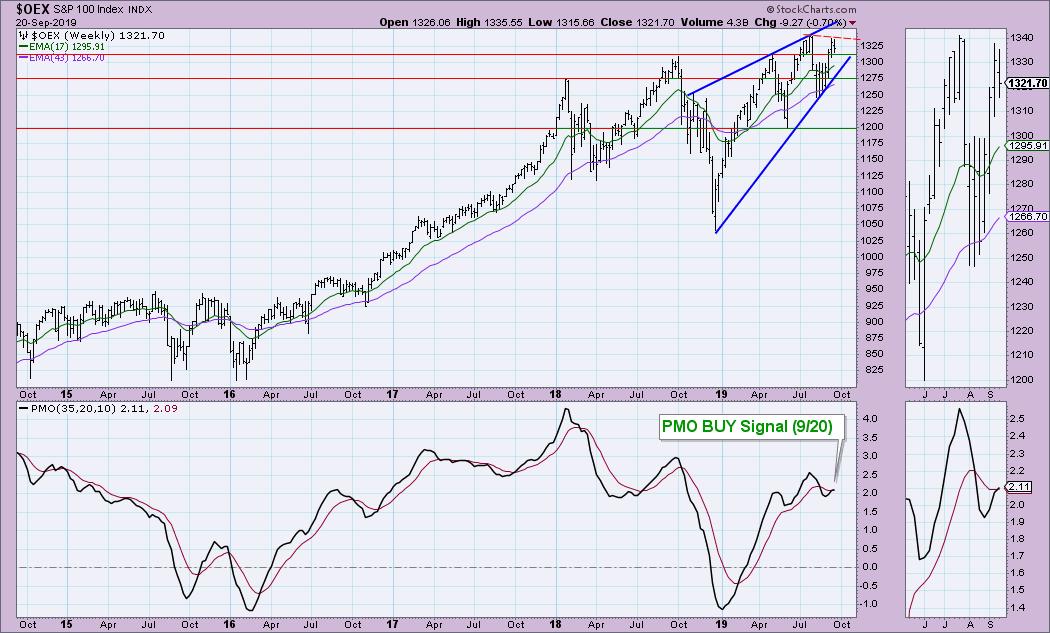
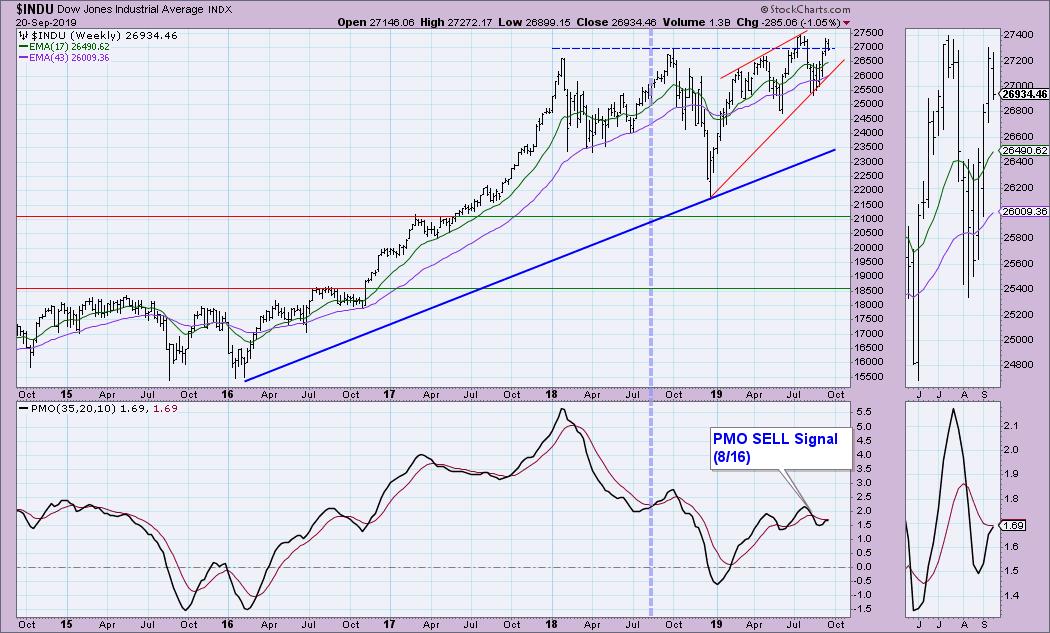
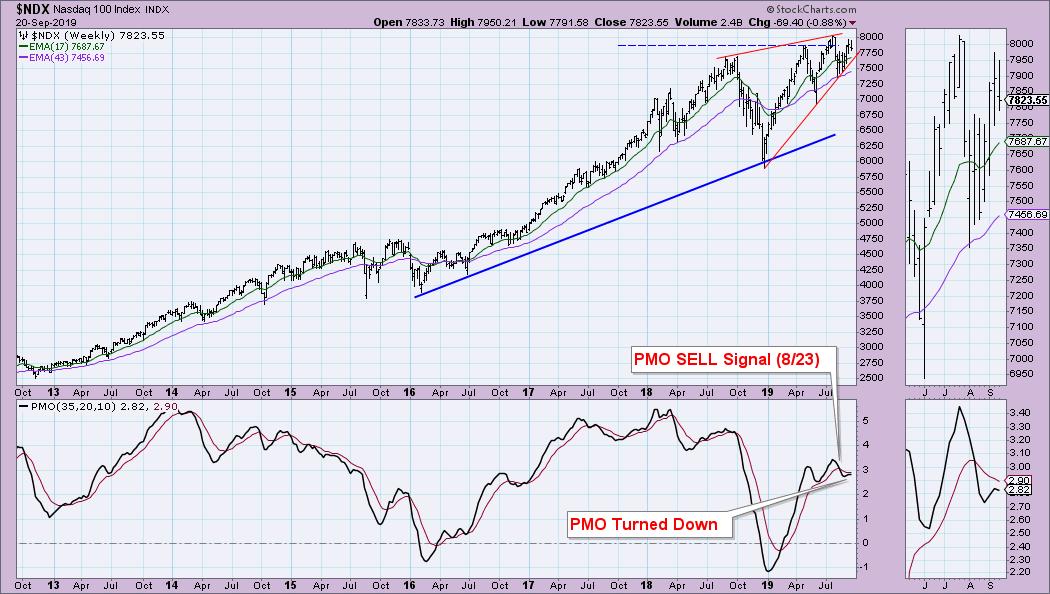
After challenging the all-time highs, the market has continued to chop along. In spite of a lackluster few weeks, the weekly Price Momentum Oscillator (PMO) managed to cross above its signal line on both the SPX and OEX, while the Dow is just about there. The surprise to me was seeing the weekly PMO on the NDX top before the IT BUY signal. With an aggressive area of the market showing negative momentum in the intermediate term, I wouldn't count on these new BUY signals sticking around for very long.
I recommend you check out Carl's Weekly Wrap when it is published Friday night to get the full analysis picture of the SPX. As noted, the PMO crossed above its signal line. One thing to note and compare with the next three charts is that the SPX still hasn't logged a top, as the intra-week high is above the previous week's. I see bearish rising wedges on all the charts. While we got this positive crossover, we are seeing a lot of market weakness with our indicators (see the Weekly Wrap).
The OEX did log a top, with this week's OHLC bar top falling below the previous week's. You can see the familiar bearish rising wedge. Also, note that while the PMO did have a positive crossover, it is decelerating.
I will be surprised if the Dow and the NDX log a new weekly PMO BUY signal by the end of the week. The PMO is decelerating on the Dow and, if we see more downside (which I believe we will), it could very well turn down like the NDX. The Dow formed a declining tops trend line with the July top and this current top. Price is also in the familiar rising wedge.
Below is the chart that concerns me. The big technology names are dragging down the NDX, with the gravity pull of this week's price decline managing to yank the PMO downward. I suspect this will happen on the indexes above. In my DecisionPoint Daily Diamonds Report yesterday, I mentioned that, when I ran my bullish PMO scan, I got 19 results. When I ran the inverse of the scan, I got 70 results! This is really tells me to stay where I am. As I mentioned at the end of the Diamonds report, I remain 60% cash. The positions I do own are in mostly defensive areas of the market (Staples, Utilities and Real Estate). Don't miss the Diamond reports in the DecisionPoint blog! I will be presenting five "diamonds in the rough" symbols that I analyze and pick from my DP scan results.
Watch the latest episode of DecisionPoint with Carl & Erin Swenlin LIVE on Fridays 4:30p EST or on the StockCharts TV YouTube channel here!
Technical Analysis is a windsock, not a crystal ball.
Happy Charting! - Erin
erinh@stockcharts.com
Helpful DecisionPoint Links:
DecisionPoint Shared ChartList and DecisionPoint Chart Gallery
Price Momentum Oscillator (PMO)
Swenlin Trading Oscillators (STO-B and STO-V)
**Don't miss DecisionPoint Commentary! Add your email below to be notified of new updates"**


