 "The appearance of U.S. Department of Defense visual information does not imply or constitute DOD endorsement."
From time to time, you come across new or different ways to look at things or describe them. In my RRG blog from Tuesday, I introduced the concept of military overwatch tactics and compared them to Relative Rotation Graphs.
Since the public launch of Relative Rotation Graphs in 2011 on Bloomberg terminals, we have been using the tagline "RRG provides you with the BIG picture in ONE picture" as a way of emphasizing the key function of RRGs. Specifically, that function is to condense the complex interaction of many securities against each other in a universe into one picture/chart. At a later stage, someone noted RRGs provided situational awareness. That analogy comes from the military, where it is crucial to know what your position is on the battlefield and where your friends and you adversaries are located, as well as - even more importantly - how, and in which direction, they are moving.
Overwatch
Recently, I have been watching some military videos and documentaries about tactics in the field and various ways to "solve problems." One thing that got my attention was the common use of "overwatch units." I remember working and training with that doctrine when I was still in the air force, but for some reason it dropped from my memory.
However, watching these videos brought it back and I immediately made the connection to Relative Rotation Graphs. These are the perfect tool to conduct overwatch and keep the engaging elements safe from enemy fire, as well as providing them with crucial information about movements of enemy units.
According to Wikipedia: "Overwatch is a force protection tactic in modern warfare where one small unit or military vehicle supports another while it is executing fire and movement tactics. An overwatching unit takes a position where it can observe the terrain ahead, especially likely enemy positions. This allows it to provide effective covering fire for advancing friendly units. The term "overwatch" was coined in U.S. military doctrine in the 1950s."
Obviously, the unit providing overwatch will position itself as high as possible relative to the units they are covering. They want to keep the big picture in sight. Analogously, RRG will do exactly that.
The US Against the Rest of the World
As most of our readers here on StockCharts are US-based or interested in US stocks, not to mention the fact that the US market is (one of) the biggest in the world, most of the content and focus is geared towards that market. There is nothing wrong with that. It would be wrong, however, to only look at the US in isolation. The world is a big place and markets and economies are getting more and more interrelated. Everything interacts with everything. That is what makes analyzing markets difficult. However, at least for me, it is also what makes analyzing markets fun.
The good news is that we have the perfect tool to help you gain perspective on how the US (stock) market is acting in relation to other markets around the world. No surprise that, IMHO, that tool is the Relative Rotation Graph.
International Stock Markets
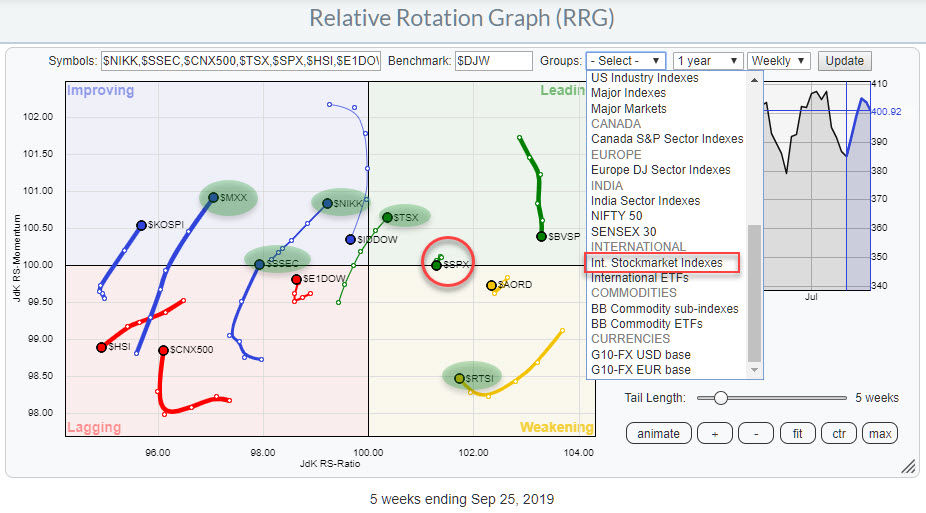
The chart above shows the RRG for international stock markets. More specifically, it shows the actual stock market indexes as opposed to the ETFs. I want to see the true relationships, without the currency effect, of the underlying stock markets as opposed to the ETFs that many investors use to get exposure to a position in an international market.
This universe of international stock market indexes is one of the predefined groups that is available on the RRG page. Click on the small arrow in the "Groups" box above the chart, scroll down to "Int Stockmarket indexes" and load this group of symbols onto the RRG.
The benchmark is set to $DJW, the Dow Jones Global index. The benchmark can easily be changed by changing the symbol in the benchmark-box. If you change the symbol (we'll use $SPX as an example) and then hit "Update", the RRG will re-render accordingly.
The benchmark will dictate how you view the universe. In this case, if you stay with $DJW, you will be looking at these international market from a global perspective. The world is your benchmark.
If you change the benchmark to $SPX, you will be looking at the world from a US point of view and be able to track rotations of international markets against relative to the US.
The chart above shows the US market ($SPX) to the right (positive territory) of the DJ Global index with a very short tail. This indicates that the relative uptrend vs $DJW is still intact and stable. So far, so good. Holding US stocks, in relation to holding stocks in other markets, still seems to be a good idea.
If you want to look for options to diversify your holdings, the markets that are at a positive RRG-heading are worth looking at. The closer to the 100-level on the JdK RS-Ratio scale, the more interesting they are.
At the moment, I am watching the rotations of $TSX, $NIKK, and $SSEC as potentially interesting. To a lesser extent, I am watching $MXX and $KOSPI, though they are still far to the left.
Canadian $TSX breaking to new highs
Out of these three markets, $TSX is the one that just broke to new highs, which makes it more interesting than the others.
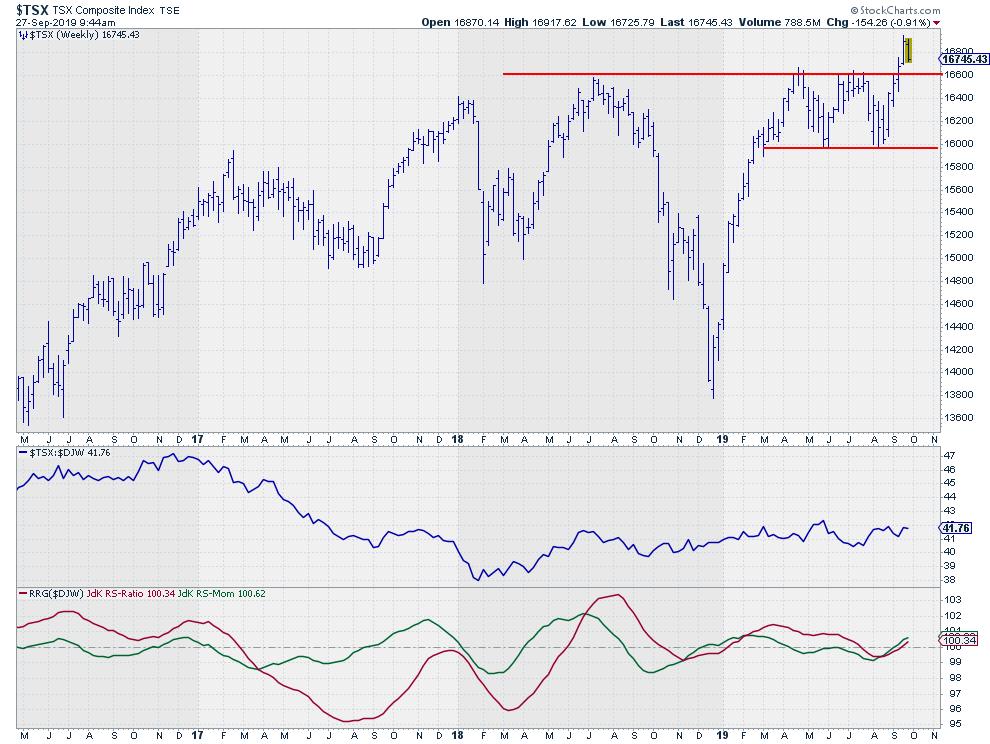
For next week, I would look for entry opportunities in the area of the former resistance level, which should now start to act as support, and use stops just below that level.
-Julius
My regular blog is the RRG Charts blog. If you would like to receive a notification when a new article is published there, simply "Subscribe" with your email address.
Julius de Kempenaer
Senior Technical Analyst, StockCharts.com
Creator, Relative Rotation Graphs
Founder, RRG Research
Want to stay up to date with the latest market insights from Julius?
– Follow @RRGResearch on Twitter
– Like RRG Research on Facebook
– Follow RRG Research on LinkedIn
– Subscribe to the RRG Charts blog on StockCharts
Feedback, comments or questions are welcome at Juliusdk@stockcharts.com. I cannot promise to respond to each and every message, but I will certainly read them and, where reasonably possible, use the feedback and comments or answer questions.
To discuss RRG with me on S.C.A.N., tag me using the handle Julius_RRG.
RRG, Relative Rotation Graphs, JdK RS-Ratio, and JdK RS-Momentum are registered trademarks of RRG Research.
Julius de Kempenaer
Senior Technical Analyst, StockCharts.com
Creator, Relative Rotation Graphs
Founder, RRG Research
Host of: Sector Spotlight
Please find my handles for social media channels under the Bio below.
Feedback, comments or questions are welcome at Juliusdk@stockcharts.com. I cannot promise to respond to each and every message, but I will certainly read them and, where reasonably possible, use the feedback and comments or answer questions.
To discuss RRG with me on S.C.A.N., tag me using the handle Julius_RRG.
RRG, Relative Rotation Graphs, JdK RS-Ratio, and JdK RS-Momentum are registered trademarks of RRG Research.


