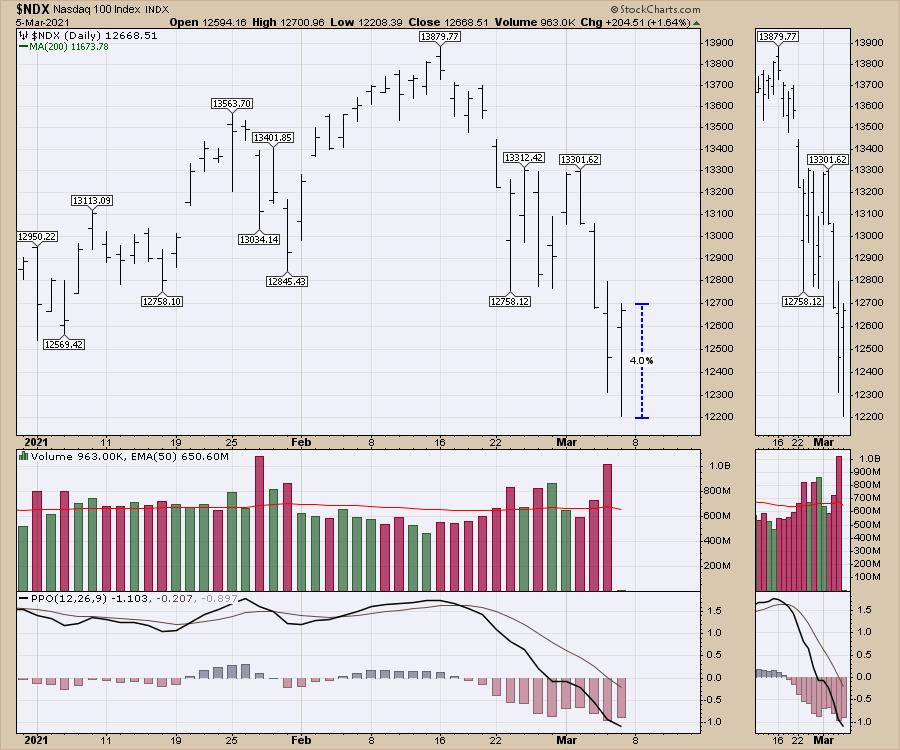
The Friday sch-w-wing on the markets was a welcome respite from the hard selling in the Technology and innovation space. The Nasdaq soared 4.0% from low to high. I like these strong intraday reversals.
One other area of the market that continues to run persistently is energy -- long forgotten, but stunningly strong. As long as the Kingdom of Saudi Arabia keeps the excess supply off the market, this upward pressure is probably going to continue.
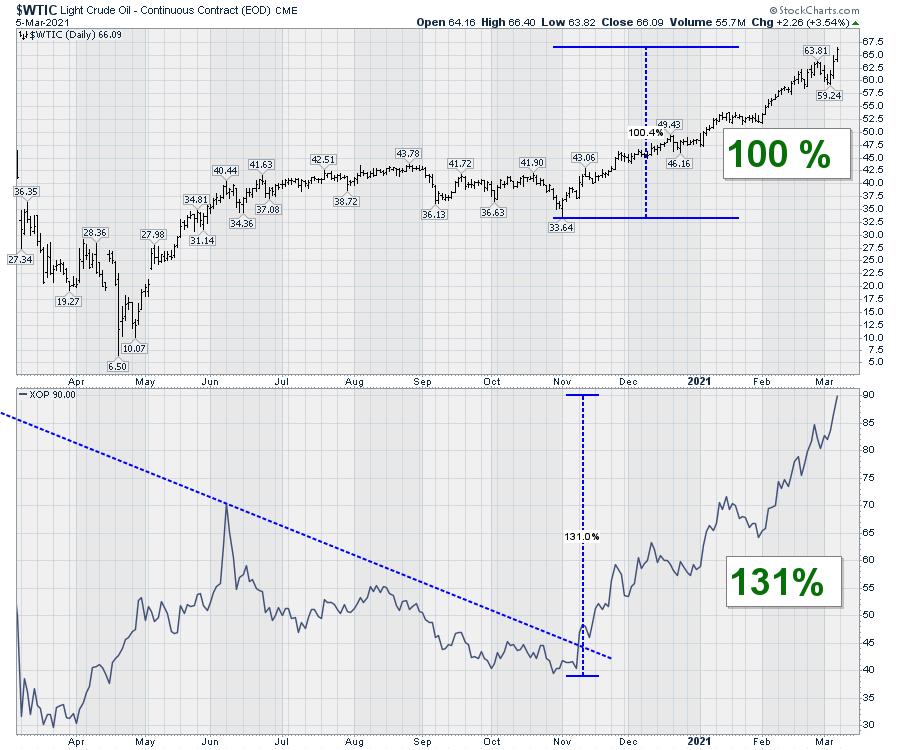
The chart below shows the doubling of the oil price from $33 at the beginning of November to the $66 close today. The XOP is outperforming the oil price by moving up 130%.
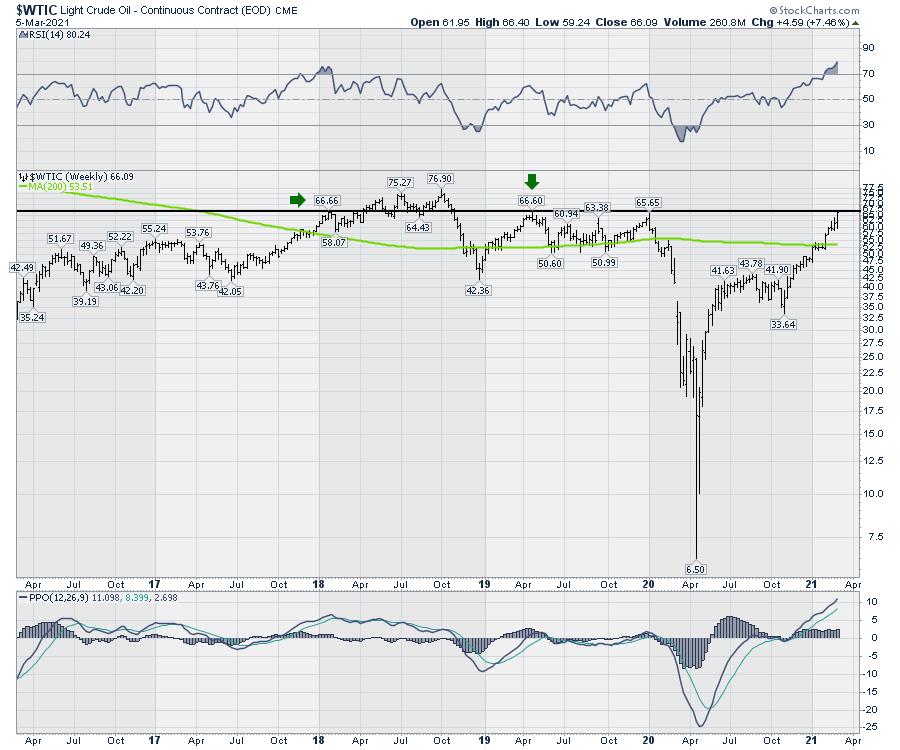
The big picture view on this is starting to become very clear. US oil prices are now above the 5-year moving average. I set the moving average to 200 weeks. We closed on 22-month highs at $66.30. The intra-week high in early 2018 is just a pump-jack push higher at $66.60. More importantly, we are entering the $10 range of the 3-drives-to-a-high price top in 2018.
It will be very important to see this play out. I have been a raging bull on energy for a while now. As long as the major oil companies continue to dismiss these price levels and focus on electric scooter networks, this price is going to continue to have upward pressure. Will five-year highs get investors attention?
I am pretty sure the oil business is tired of being called the ugly duckling, and President Biden, along with other world leaders, are creating a market for higher prices. Commodity cycles can really upset the best laid plans.
We have just set up a new sale for our membership in the month of March. You can save over 40% ($363) and pick up an annual subscription for $497 at GregSchnell.com. If your portfolio was roundly smoked by the recent correction, you'll enjoy the clues provided by the Schnell Strength Indexes to help miss the downside.
With kind words from subscribers this week: "Your analysis has literally saved the downfall in my portfolio, huge huge appreciations and thank you for doing this wonderful work." S.
Good trading,
Greg Schnell, CMT, MFTA
Senior Technical Analyst, StockCharts.com
Author, Stock Charts For Dummies
Want to stay on top of the market's latest intermarket signals?
– Follow @SchnellInvestor on Twitter
– Connect with Greg on LinkedIn
– Subscribe to The Canadian Technician
– Email at info@gregschnell.com


