Much has been made of the oil trade this year, and we have seen other commodities swing wildly, but higher. It continues to be a strong area for swing traders to outperform. Some of the tech names have been rocking it to the upside too. It's not a one-trick-pony type of market; there are opportunities out there and, right now, the trend is higher. The $SPX is up 6.5% since the start of this chart, but is up 7.5% from one month ago. It has been a fast-moving ride to the high side. The indexes are performing very well and breadth has been wide and positive.
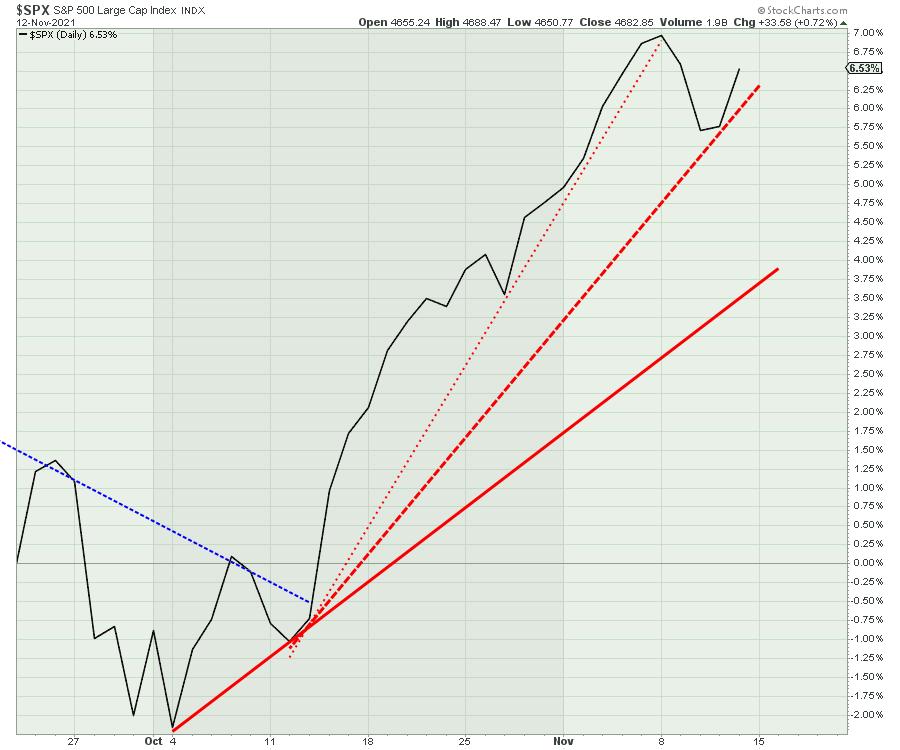
I look at the steep uptrend line and it has been one for the record books; 9.5% in a month from October 4 to November 5. The second trend line is still very steep; it represents a fast-moving market with a wiggle this week. Using the October 4th low and the October 11th row to generate the solid red line, it would still be a fabulous monthly gain of 5%.
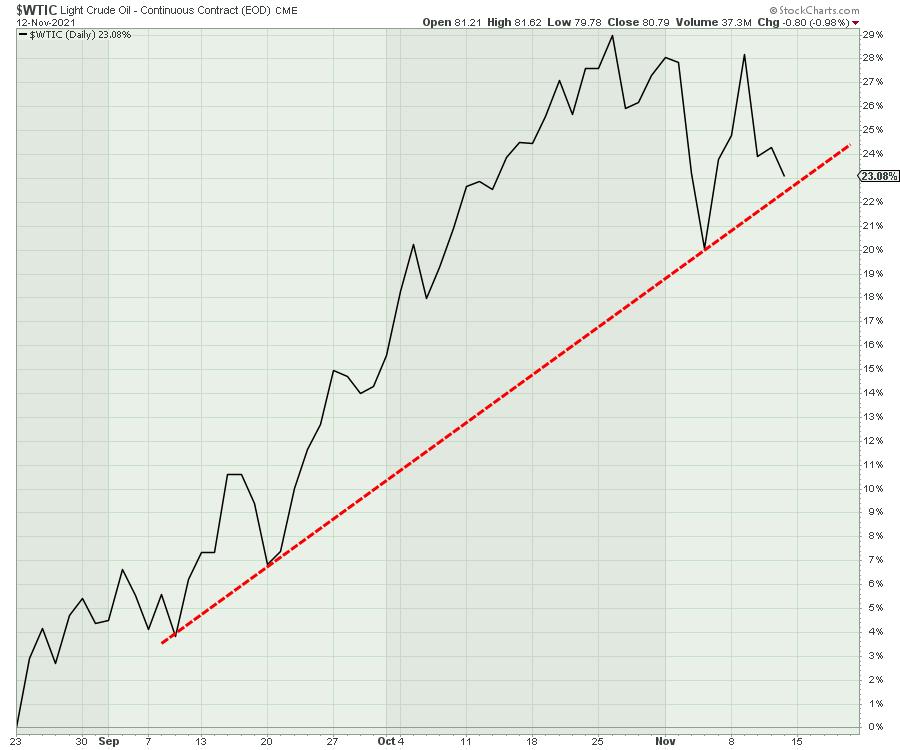
Crude oil, with the last three months shown below, has been a strong move higher, but it has rolled over in recent weeks. The percentage gain is still huge, but the chart is relaxing a bit currently.
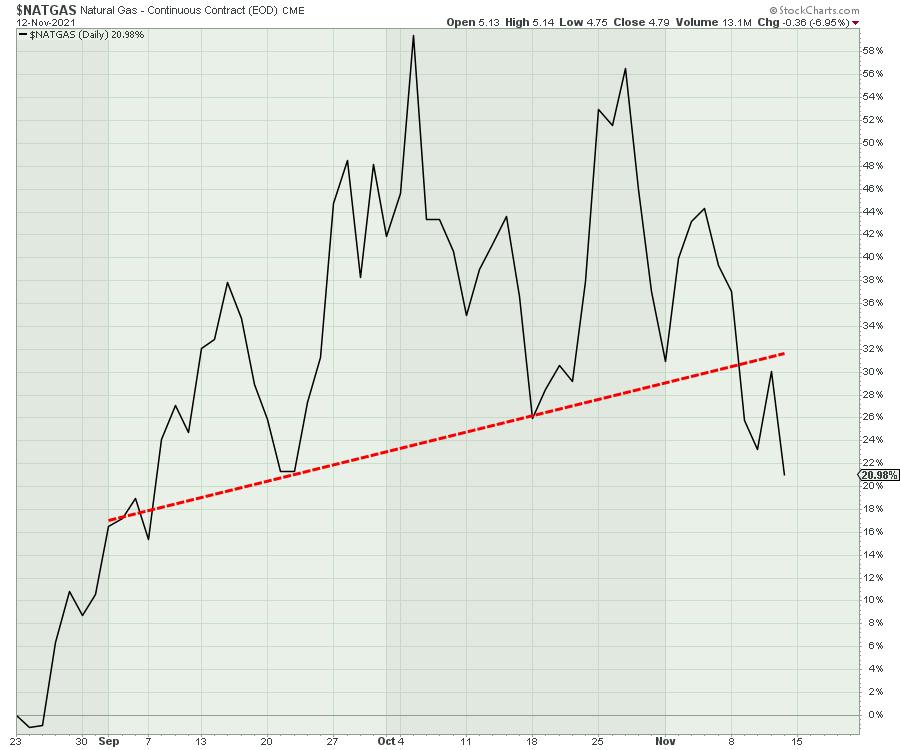
Natural Gas has also waned a bit. The seasonally strong period for natural gas is ending and it is not surprising to see it unwind a little. With the low level of supply pressures on Europe and Asia for Natural Gas, LNG tankers will be taking all the Natural Gas they can to move this around the world where prices are much higher. But the chart is still topping out for now.
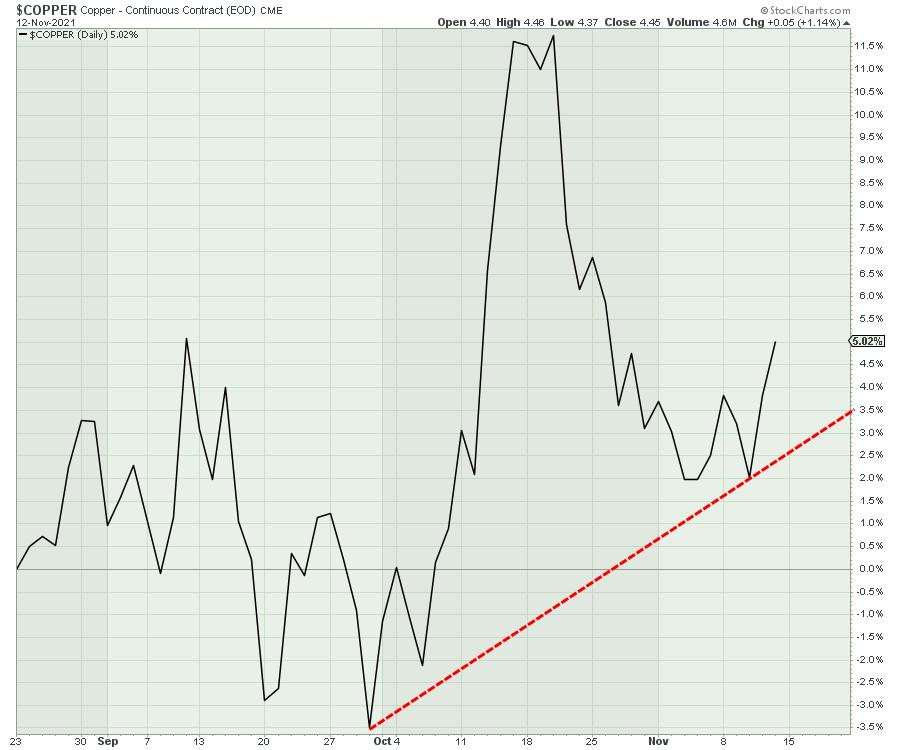
Copper has been correcting since May and started to move higher in October with other commodities. The next few weeks should tell us if this rally continues to push to the upside meaningfully or if it can't hold this rally and it breaks down here. The copper chart has definitely been a more difficult chart to trade.
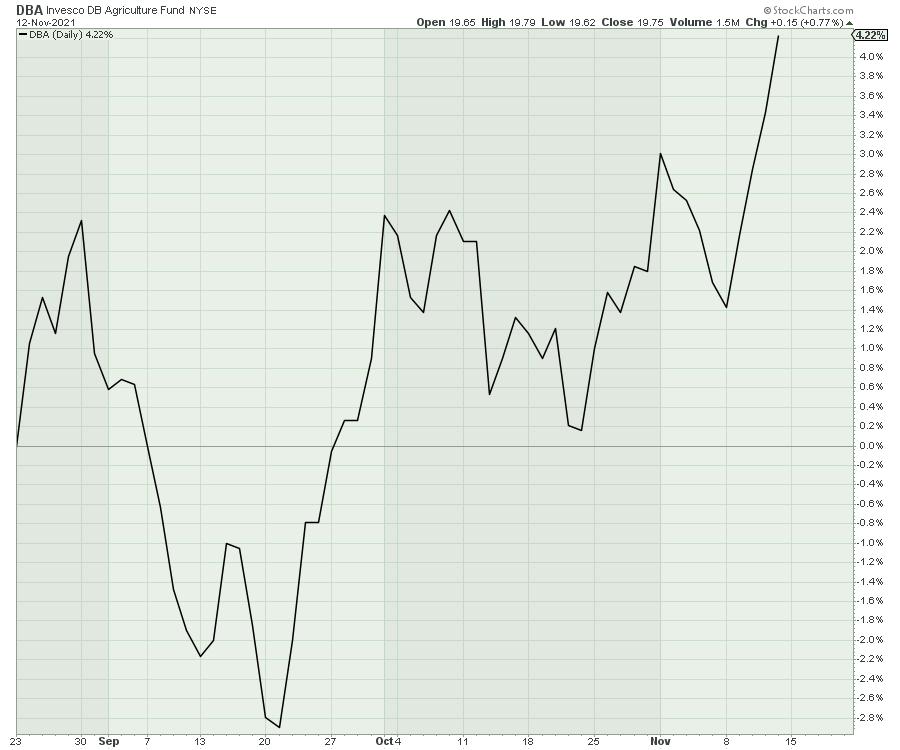
One of the bigger commodity-related opportunities would appear to be in agricultural commodities. The easiest way to see that area is through the DBA ETF, which started to rally in September.
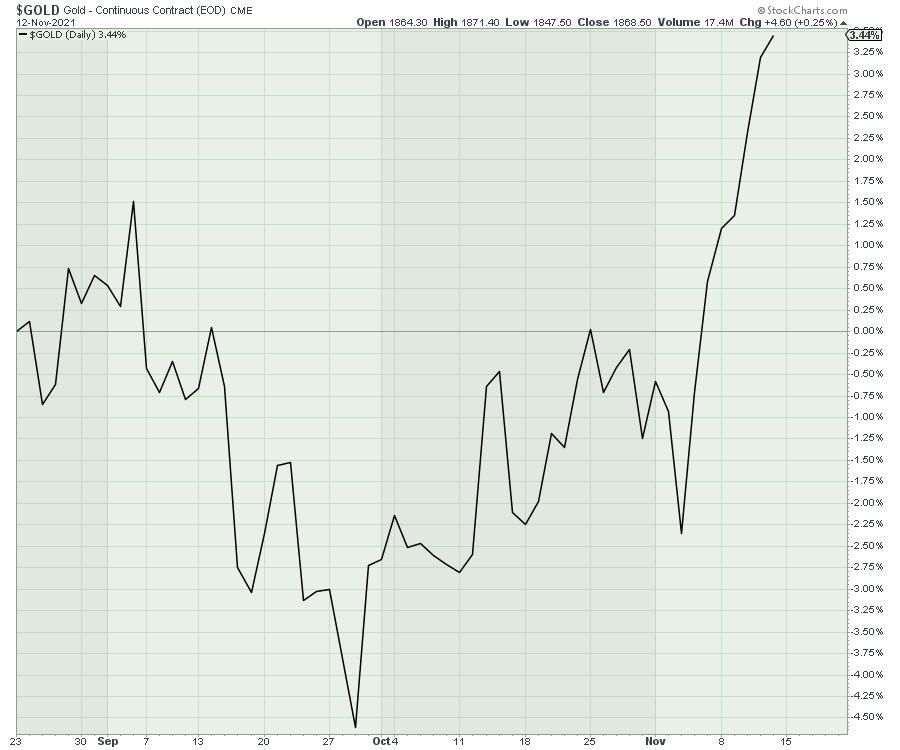
Most of you will have been alerted to the moves in Gold and Silver this week. The gold chart is clearly accelerating higher, now 6 weeks off the low. Gold made a nice clean breakout this week.
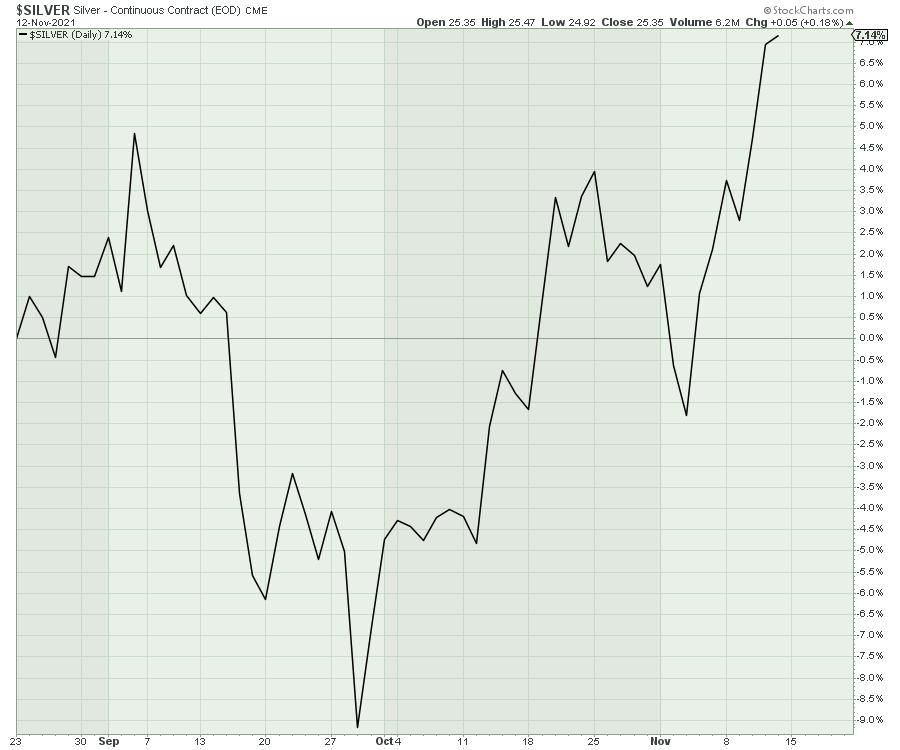
Silver shimmered as well and it has been rallying for 6 weeks.
So there appears to be a changing of the guard right now. The wild outperformance of Natural Gas and Crude Oil seems to be changing to agriculture, gold and silver. I am trying to stay with what is working. We'll need more information from the copper chart to see if it is going to keep moving higher with the precious metals charts.
Head on over to GregSchnell.com/explore to find more trading ideas and join our community there.
Good trading,
Greg Schnell, CMT, MFTA
Senior Technical Analyst, StockCharts.com
Author, Stock Charts For Dummies
Want to stay on top of the market's latest intermarket signals?
– Follow @SchnellInvestor on Twitter
– Connect with Greg on LinkedIn
– Subscribe to The Canadian Technician
– Email at info@gregschnell.com


