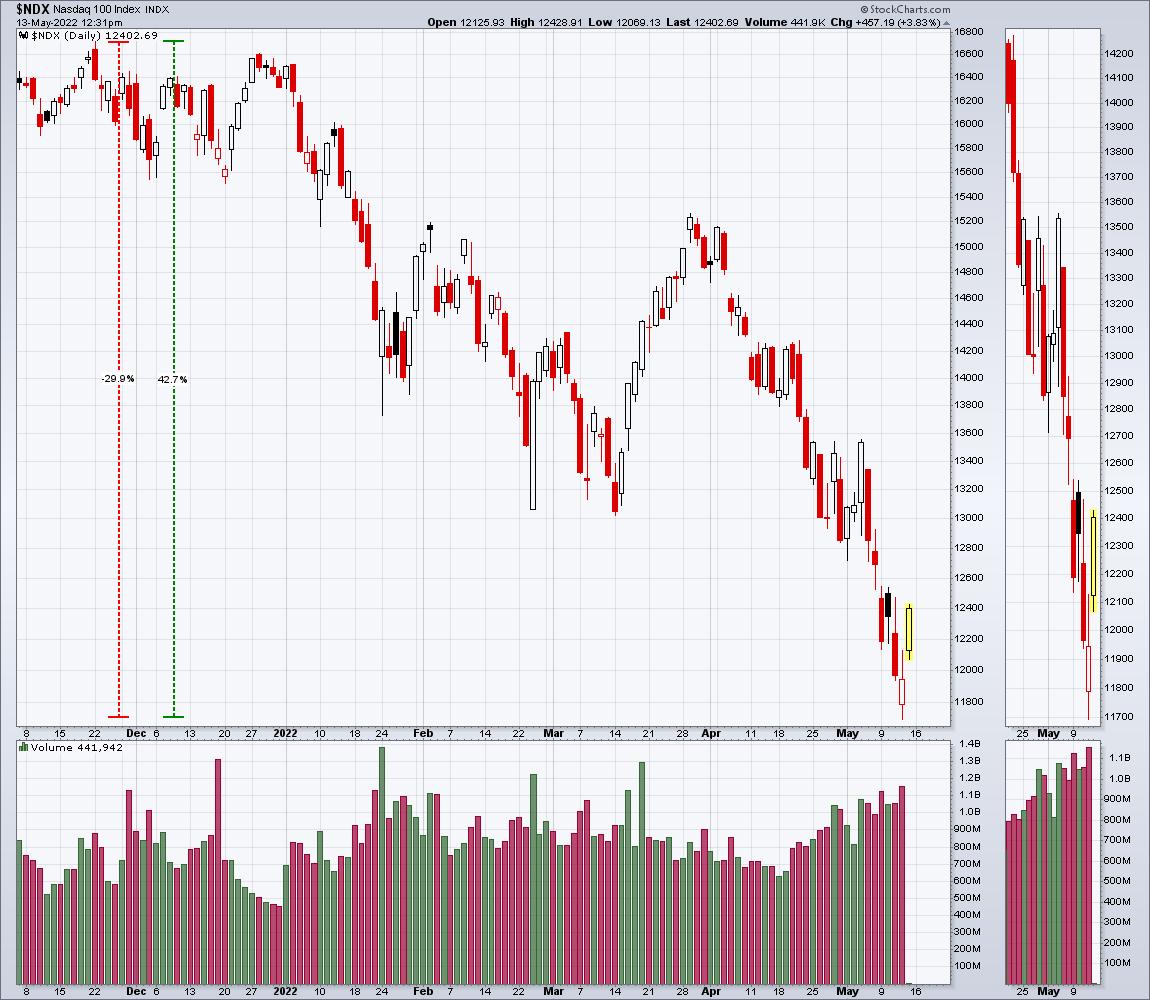
Tech shares have been pounded for the last 6 months after making their highs in November. This week, we saw some significant lows. The Nas-dawg 100 was down 30%. That's not 30% of the gains since 2020 -- that's 30% of the whole price. That is a massive haircut. Perhaps the move on Friday marks a move for Tech trying to thrust higher.
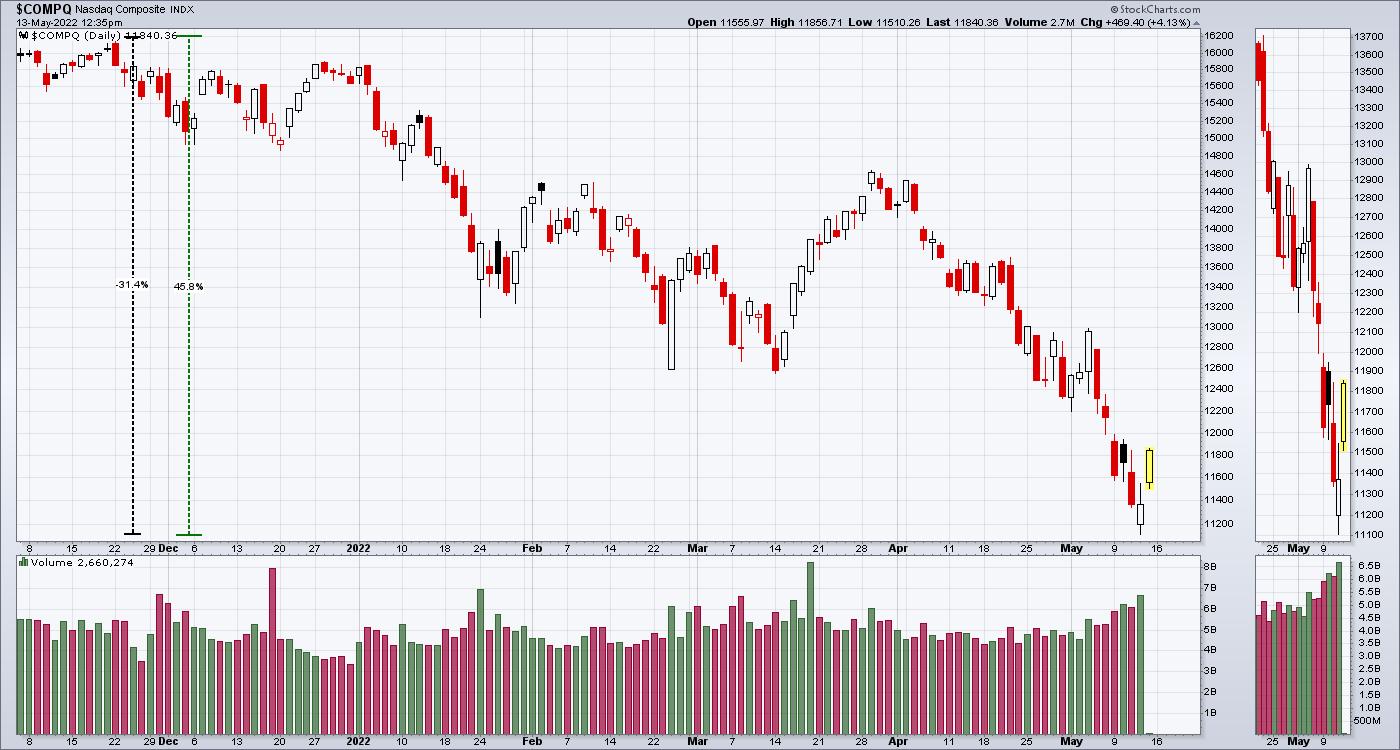
Looking at the Nasdaq Composite, it is similar, but the broader Nasdaq is where a lot of the massive damage was done. Because the companies were so small, it didn't really damage the Index more than the Nasdaq 100. The reason is the indexes are market cap-weighted. That means that, the more the shares are worth of a company, the bigger the weighting in the index. Although companies like PTON, ZM, LSPD have had drops way bigger than 30%, their weighting in the index was not as big.
The $SPX represents 500 large companies as a broad index across all the sectors. As tech was hit the hardest, the blow was softened by owning a broader index. The $SPX only fell 20%. While that is still painful, the Nasdaq 100 drop was 50% more painful. The percentages can get confusing, but the bottom line is that the Nasdaq composite was where the majority of pain was felt. The Nasdaq 100 was a little better, while the $SPX was significantly better but still down 20%.
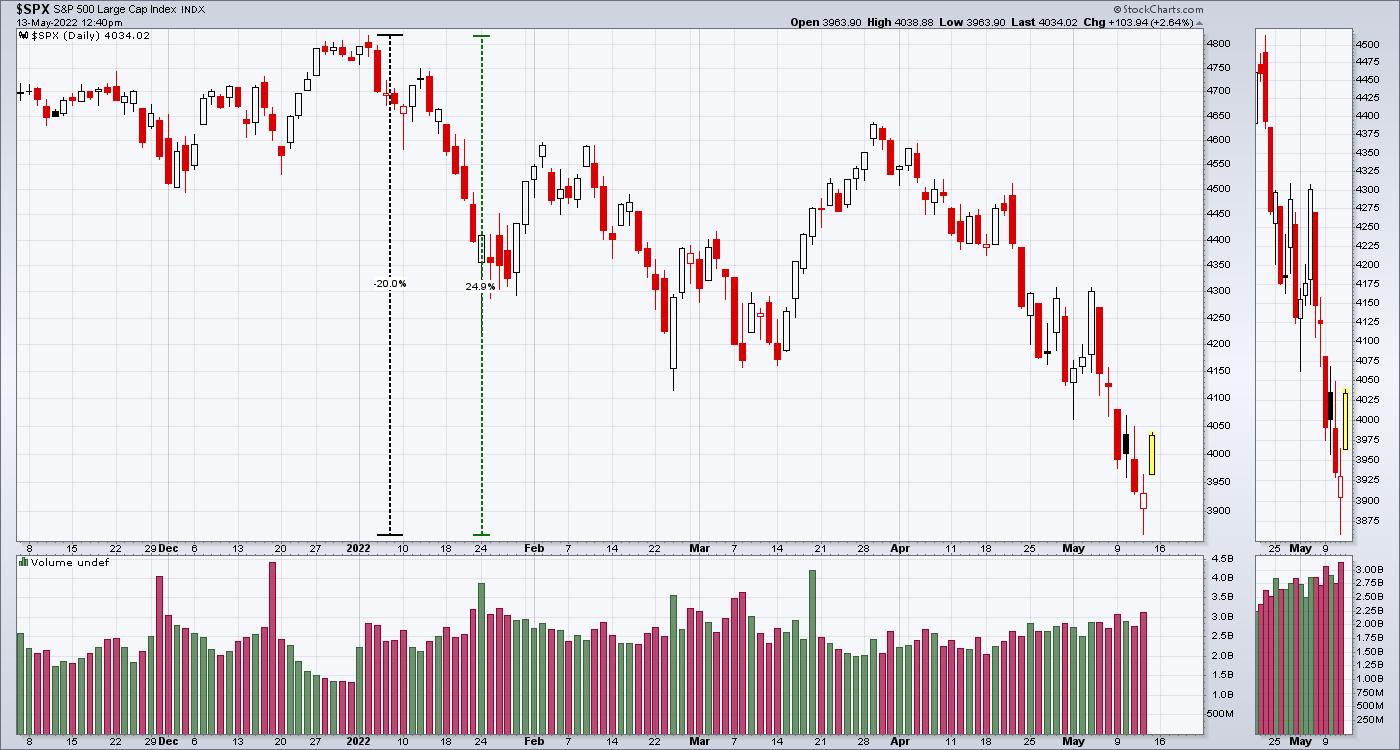
However, on each of the charts above, you'll notice two dotted columns. The black column is how much the market dropped. The green column is how much of a gain we need to get back to the highs again.
- $SPX - 25%
- $NDX - 42%
- $COMPQ - 45%
So, being in a damaged area of the market is definitely a problem and a lot harder to get back to the previous highs. With all that said, the market was very resilient in the face of negative news this week. Price is going out near the highs of the week which is a big change.
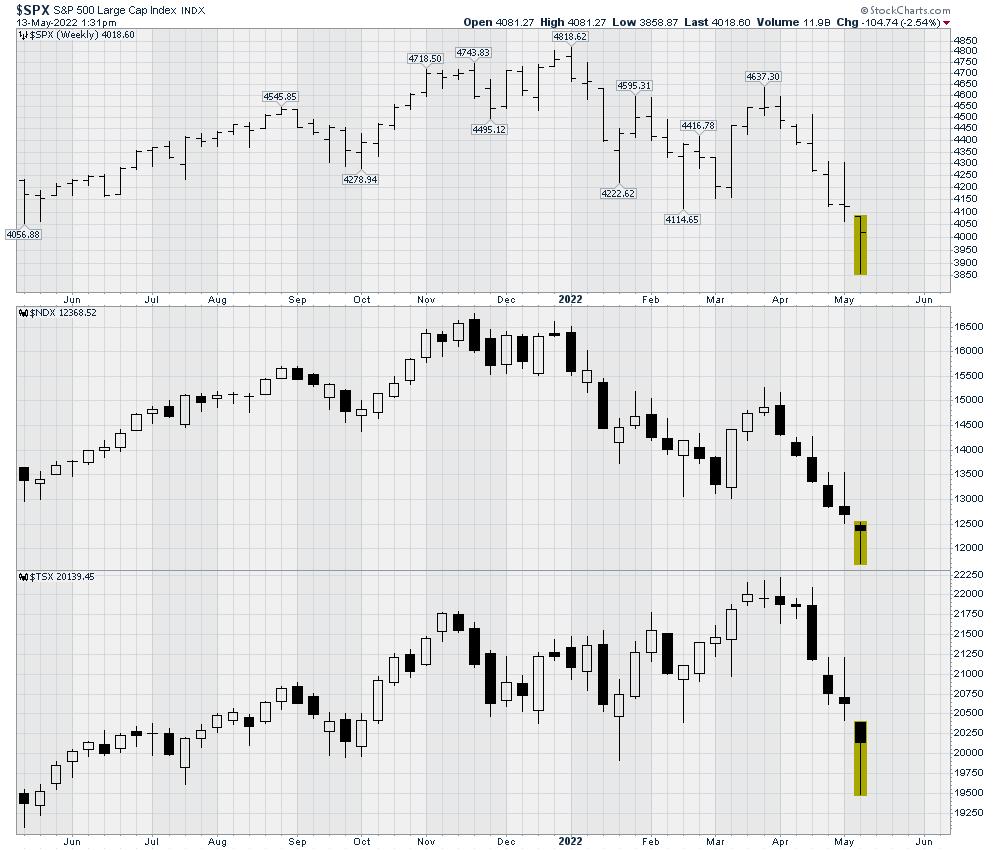
Still need to be cautious, but the 30% pullback is massive, and a rally even halfway back to the highs would be a wonderful gain. For more information on trading when we have the wind at our back, check out OspreyStrategic.org. We do have a trial package at $7 for the first month to see if you like it.
Good trading,
Greg Schnell, CMT, MFTA
Senior Technical Analyst, StockCharts.com
Author, Stock Charts For Dummies
Want to stay on top of the market's latest intermarket signals?
– Follow @SchnellInvestor on Twitter
– Connect with Greg on LinkedIn
– Subscribe to The Canadian Technician
– Email at info@gregschnell.com


