|
|
Here at StockCharts, we are always striving to make our website better. One of the most important ways we can be better is to have our website always be available to our users and provide them with charts as quickly as possible. Keeping a website running 100% of the time is not easy - as recent events continue to demonstrate - but it is always our goal and we continually track our progress towards that goal.
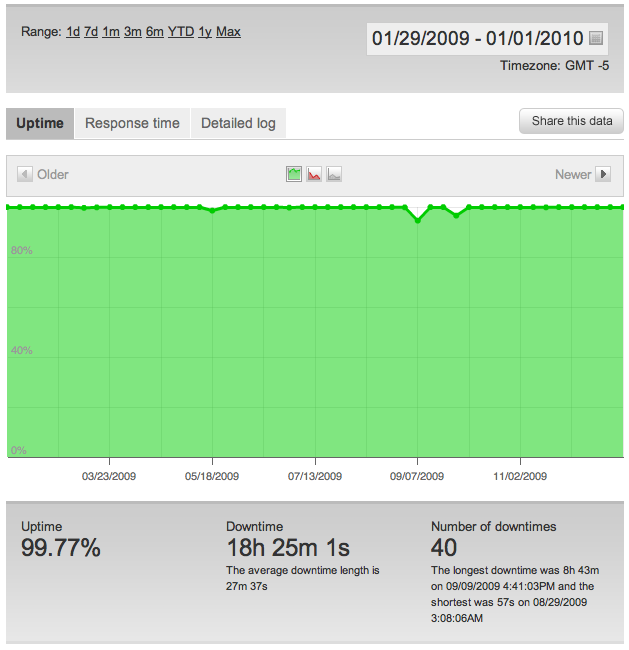
Here are two reports from our independent performance monitoring service - Pingdom.com. These reports show the improvement in uptime reliability and speed that we made in 2010 when compared to 2009. First, here's the Uptime report for 2009:
The important things to notice are the three numbers at the bottom of the report - we had trouble 40 times in 2009, we were not available for over 18 hours total giving us an uptime percentage of 99.77%.
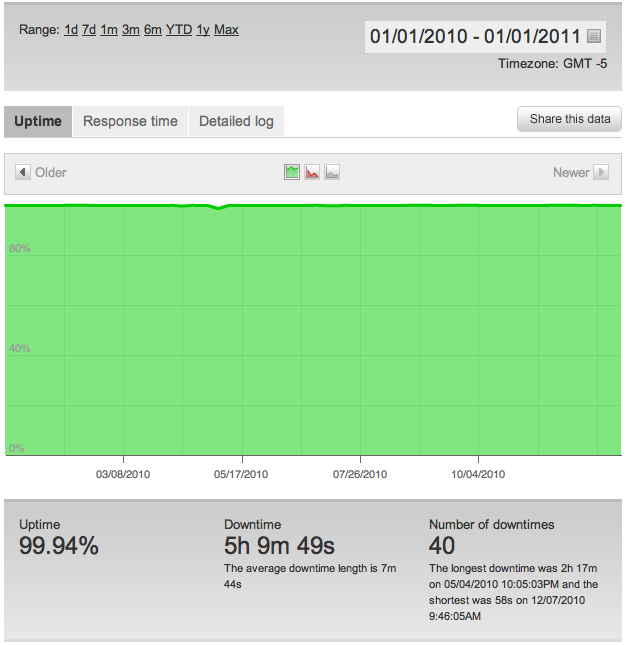
Now here's that same report for all of 2010:
As you can see, our downtime in 2010 was 5 hours and 9 minutes which improved our Uptime Percentage to 99.94% People in the industry talk about the "number of nines" that you have, meaning how many nines in your Uptime Percentage. In our case, we went from 2 nines in 2009, to 3 nines in 2010.
So you can see that our availability numbers improved significantly in 2010 when compared to 2009. THAT DOESN'T MEAN WE ARE SATISFIED WITH THESE NUMBERS. But it does show that we are making progress towards our goal of 100% uptime.
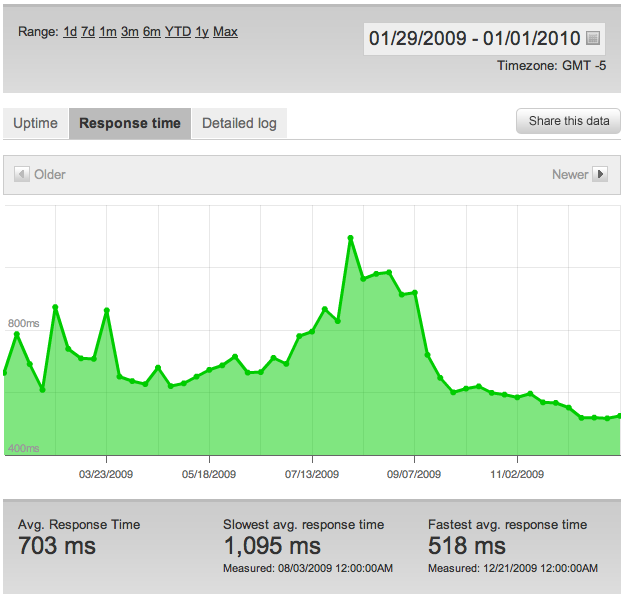
Another area we look at is Response Time. Our site also needs to be as fast as possible. So how did we do in 2010 in terms of Response Time? Here's the 2009 report:
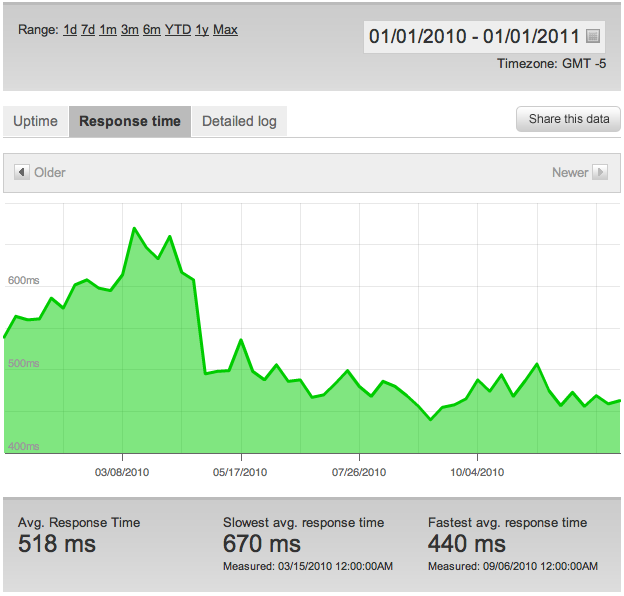
and here's the 2010 version of that same report:
Just like with our Uptime numbers, our Response Time numbers are significantly better for 2010. In fact, in 2010 our average Response Time (518ms) was equal to our best Response Time in all of 2009. Looking at the graph, a programming change we made in April clearly helped things.
The bottom line here is that we are continuing to make progress towards our goals of increased reliability and increased performance. Does this mean that we won't have problems in the future? Murphy's Law says that we probably will. But we will continue to work hard to try and minimize any issues and hopefully get even more "nines" in the future.
Thanks for being a terrific StockCharts.com supporter! Have a safe and happy New Year's everyone.
- Chip


Posted by: Dennis Deschamps January 02, 2011 at 10:11 AM