|
|
We've just added "Correlation Coefficient" to the list of indicators that are available on StockCharts.com. Correlation Coefficient is a number between +1.0 and -1.0 that indicates how well two different ticker symbols move together.
A correlation coefficient of +1.0 means that the two ticker symbols move in exactly the same way - they both go up together and they both go down together. A correlation coefficient of -1.0 means that they move in exact opposite ways - when one goes up, the other goes down and vice versa.
A correlation coefficient of 0.0 means that the movements of one stock has no apparent effect on the other one.
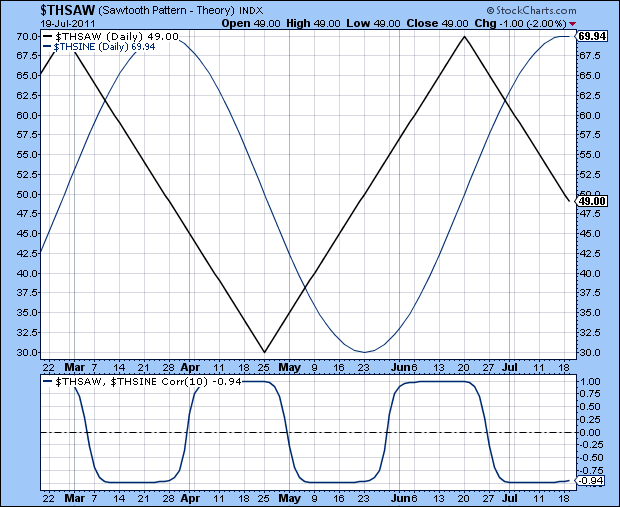
Check out this chart of our theoretical Sine wave and theoretical Sawtooth wave charts:

(Click the chart to see a live version.)
Notice that the Correlation Coefficient moves from +1.0 to -1.0 and back again as the two waves first mimic each other and then - since $THSAW reverses sooner than $THSINE - move in opposite directions.
The Correlation Coefficient indicator takes two parameters - the ticker symbol of the symbol to compare with the main chart's symbol, and the number of periods to look at.
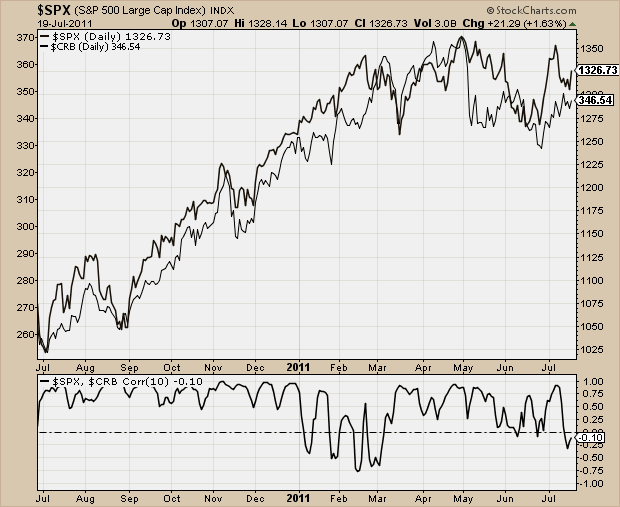
A more real-world application of the Correlation Coefficient is with Intermarket Analysis. Now we can see a precise number that describes the relationship between Stocks and Commodities, Commodities and Bonds, etc.
(Click on the chart to see a live version)
Enjoy!
- Chip


Posted by: Aly Somji July 21, 2011 at 05:30 AM