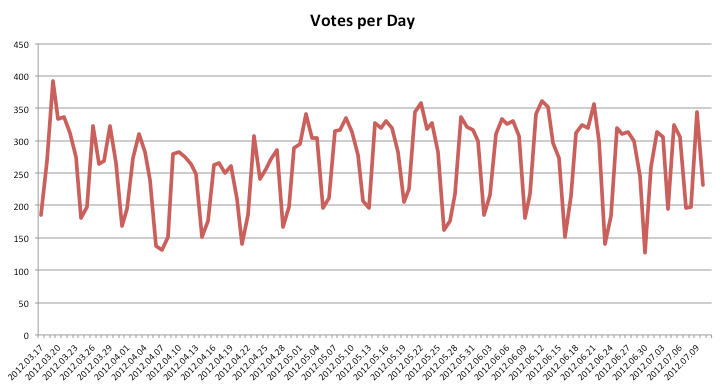
Our new Public ChartList system was launched almost 4 months ago and it has been working very well. Because it depends on actions by both the authors and the readers, I thought I would check to see how the overall voting trend has been going since the launch. Check out the following chart:
This chart shows the total number of votes that were cast on each of the days since the new Public ChartList area was launched. As you can see, voting on days when the market is open is much heavier than on days when the market is closed which makes sense. Also, in
Read More

