|
|
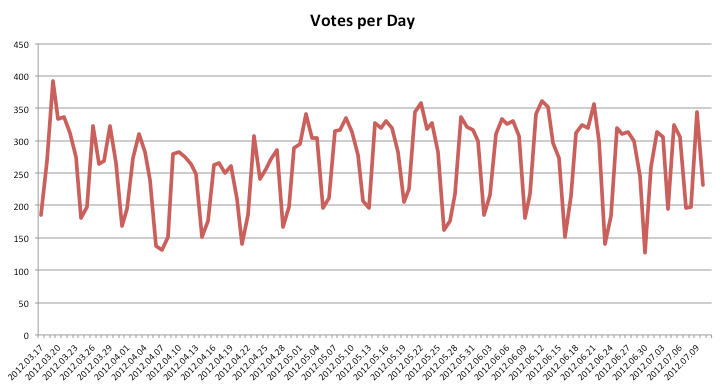
Our new Public ChartList system was launched almost 4 months ago and it has been working very well. Because it depends on actions by both the authors and the readers, I thought I would check to see how the overall voting trend has been going since the launch. Check out the following chart:
This chart shows the total number of votes that were cast on each of the days since the new Public ChartList area was launched. As you can see, voting on days when the market is open is much heavier than on days when the market is closed which makes sense. Also, in general, the average number of votes has remained relatively steady at about 260 votes per day.
What I'd really love to see however is an INCREASE in the number of votes. If you think about it, everyone gets 3 votes per day and therefore 260 votes could mean that as few as 87 members are participating in the Public ChartList voting each day. That's really not a lot.
I'd love to see many more people get involved with reading and rewarding our Public ChartList authors. The Public ChartList area of our website is a tremendous resource. Please take some time and review the information that is presented there and then vote for the lists that you enjoyed.
Voting is simple - just make sure you are logged in to your StockCharts.com account and then click the Yellow "Vote" button at the top of each list that you like. Remember, members can vote for up to 3 ChartLists each day.
So this can be a win-win-win situation. By reading the Public ChartLists area and voting, you will learn from those charts and comments, you will also make the list authors happy by voting, and I will see my vote graph start to go up.
The highest daily vote total so far has been 392 soon after the new system was launched. With a little effort, I'm positive we can beat that record. Be sure to vote and be sure to get your StockCharts friends to vote. Let's start stuffing!
- Chip


