|
|
Aug-14 Update: CTRL+Drag now works as a shortcut to create a filled rectangle with 33% opacity. (CMD+Drag for the Mac). Keep reading for more info on other rectangle settings...
Continuing our week of great new features, we just released a big update to the Flash version of our ChartNotes annotation tool. There are several amazing new features in this new version which we will be blogging about and documenting in the next couple of days. I wanted to start with the new features we've added to rectangles.
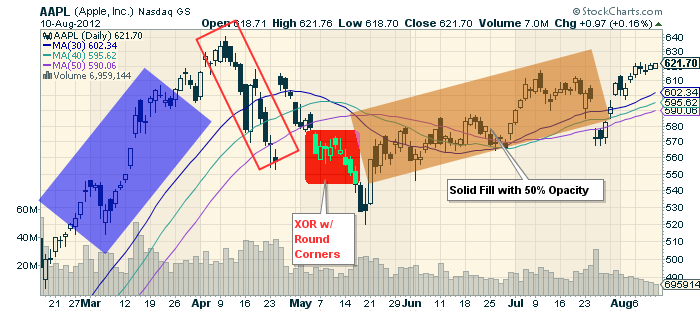
You can now create rotated rectangles (great for pointing out trends). You can also fill the rectangles just like before (called XOR mode) or fill them with a solid color. You can round the corners. Finally, you can control the opacity (aka, transparancy) of the filled rectangles. Here is a chart with some examples:
The first thing you need to know to create these boxes is that - after drawing/selecting your rectangle - you need to click the "(+)" symbol in the upper left corner of the ChartNotes window to open up the various rectangle settings. You'll see boxes that allow you to set the color, fill type, opacity, and corner types.
The second thing you need to know is that to rotate a rectangle, you first select it, then hold down the CTRL key, then click and drag one of the yellow handles that appear.
Stay tuned for more on ChartNotes' new features - or start exploring if you can't wait!
- Chip


